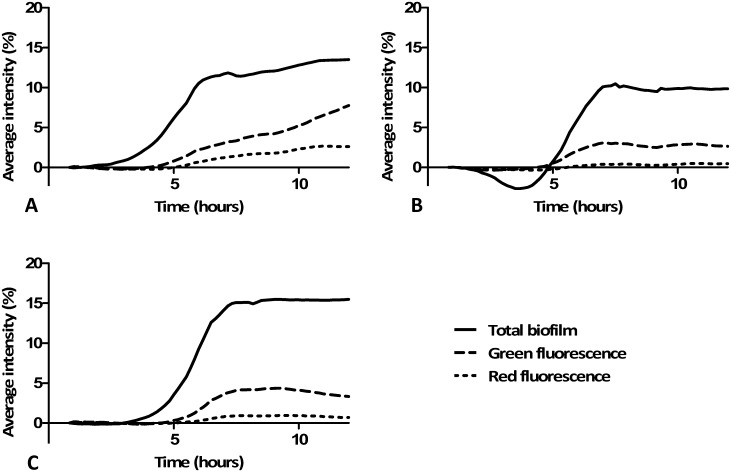
Fig 4. Average biofilm growth with its fluorescence.
The graphs show a typical example of biofilm growth with its green and red fluorescence. A: anaerobic biofilm grown with artificial saliva medium and 10% serum; B: anaerobic biofilm grown with artificial saliva medium and 0.2% sucrose; C: aerobic biofilm grown with artificial saliva medium and 0.2% sucrose. The reduction of total biofilm in (B) can be explained by clumps of buccal cells, present at inoculation, which are at later flowed away due to the continuous medium flow in the model. This example was grown from inoculum from a clinically high-fluorescent, high-bleeding on marginal probing participant. Results from the other seven inocula are shown in S1 Fig.

