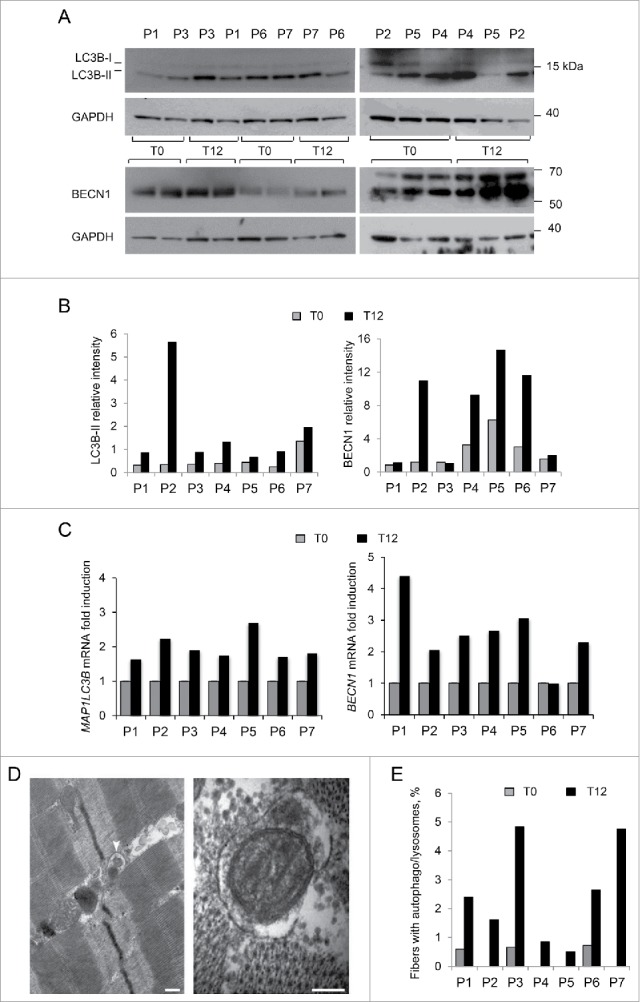
Figure 1.

Analysis of autophagy in muscle biopsies of BM and UCMD patients before and after LPD trial. Muscle biopsies from 7 adult patients (P1-P7) were taken before (T0) and after 12 mo LPD (T12). (A) Western blot of MAP1LC3B (LC3B) and BECN1 protein levels in lysates of muscle biopsies at T0 and T12. GAPDH was used as a loading control. Data are representative of at least 3 technical replicates. (B) Densitometric quantification of western blots for LC3B and BECN1. LC3B-II and BECN1 protein levels were calculated as relative intensity with respect to GAPDH. Data represent the mean values (3 experiments) for each patient at T0 and T12. P = 0.018 and P = 0.028, respectively, for the comparison of LC3B-II and BECN1 mean values between T0 and T12 (Wilcoxon signed rank test for paired data). (C) Quantitative RT-PCR analysis of MAP1LC3B and BECN1 mRNA levels at T0 and T12. Data represent the mean value (2 experiments) for each patient at T0 and T12. P = 0.018 and P = 0.028, respectively, for the comparison of MAP1LC3B and BECN1 mean fold induction between T0 and T12 (Wilcoxon signed rank test for paired data). (D) Transmission electron micrographs of muscle biopsies after one-y LPD. Representative images of autophagosomes detected in muscle fibers of patient 1 (left panel) and patient 3 (right panel) containing degraded material (left panel, white arrowhead) and a degenerating mitochondrion (right panel). Scale bars: 200 nm. (E) Quantification of myofibers with autophagosomes/autolysosomes, as determined by transmission electron microscopy analysis of muscle biopsies from patients P1-P7 at T0 and T12. The graphs show the percentage of myofibers containing autophagosomes or autolysosomes from 5 different levels for each biopsy. P = 0.016, for the comparison between T0 and T12, following Wilcoxon signed rank test for paired data.
