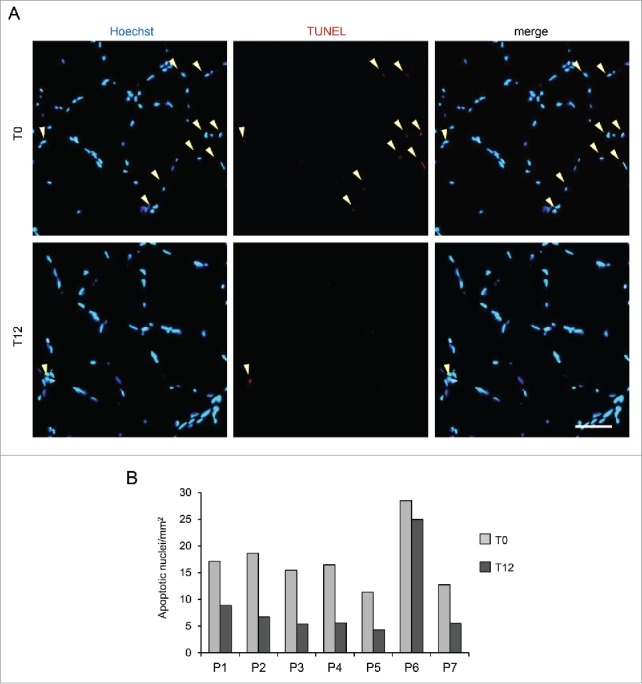
Figure 2.

TUNEL assay on muscle biopsies of BM and UCMD patients before and after LPD trial. Muscle biopsies from the 7 patients (P1-P7) were analyzed for apoptosis incidence before (T0) and after a 12-mo LPD (T12). (A) Representative micrographs of TUNEL assay on muscle biopsies of patient 2 at T0 (upper panels) and T12 (lower panels). Nuclei were stained in blue with Hoechst, TUNEL-positive nuclei are in red. Scale bar: 50 µm. (B) Quantification of TUNEL-positive nuclei per area in muscle biopsies from patients P1-P7 at T0 and T12. Mean values from 2 technical replicates of TUNEL assay experiments per condition are shown. P = 0.016, following Wilcoxon signed rank test for paired data, for the comparison between mean values at T0 and T12.
