Figure 5.

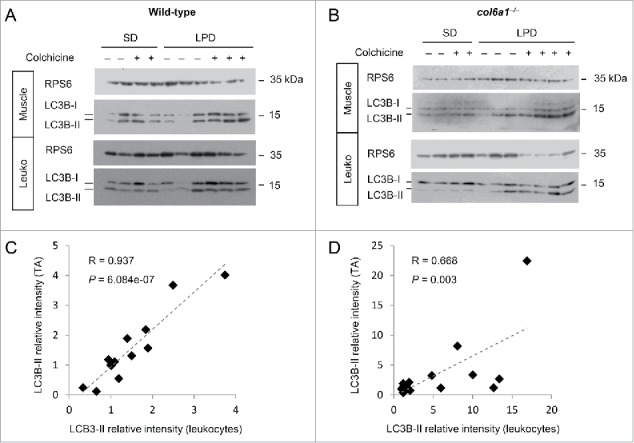
Autophagy activation after LPD is similar in muscles and in leukocytes of wild-type mice and col6a1 null mice. (A, B) Western blotting of MAP1LC3B/LC3B in protein lysates of tibialis anterior muscles and blood leukocytes (Leuko) from wild-type and col6a1 null (col6a1−/−) mice fed either with standard diet (SD) or low-protein diet (LPD) for 30 d. Each lane corresponds to one animal. For each condition, animals were injected with 0.4 mg/kg/d of colchicine at the end of the diet, to visualize the autophagic flux. RPS6 was used as a loading control. (C, D) Scatter plots showing linear association (dotted line) between LC3B-II relative intensity in tibialis anterior (TA) and leukocytes from western blot analysis as shown in (A and B). Relative protein levels of LC3B-II in muscles and leukocytes were quantified vs RPS6. Each point corresponds to one animal. Pearson coefficients (R) and P values are shown.
