
Figure 7.
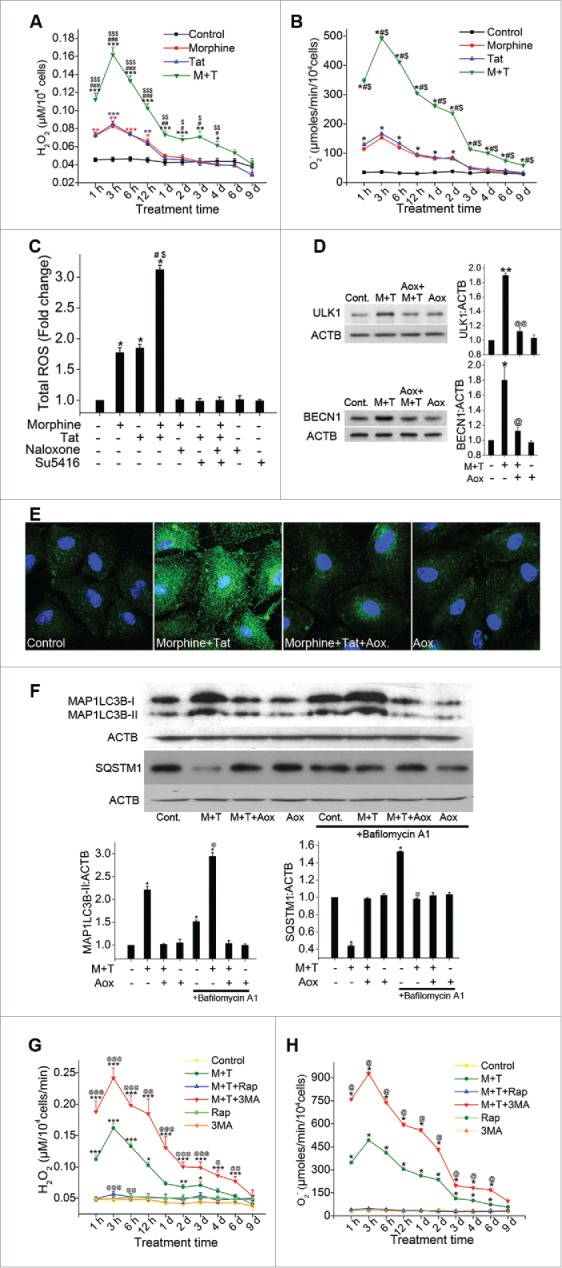
Morphine and Tat-mediated enhanced oxidative stress activates autophagy in endothelial cells. (A) Analysis of H2O2 or (B) superoxide levels in morphine (1 μM) and/or HIV-Tat (25 ng/ml)-treated HPMEC for the indicated time points by amplex red assay or SOD-inhibitable cytochrome C reductase assay, respectively. C) HPMEC (2 × 10⁴ cells/well) plated on a 96-well plate were pretreated with naloxone (1 μM) and/or Su5416 (0.5 µM) followed by morphine and/or Tat for 3 h and measurement of total reactive oxygen species using the DCF assay kit. (D and E) Confluent HPMEC were pretreated with antioxidants for 30 min followed by 6 h Tat and morphine treatment for western blot analysis for ULK1 and BECN1 expression (D) and for MAP1LC3B immunofluorescence staining (100X magnification) (E). (F) HPMEC were pretreated with antioxidant cocktail (Aox) and/or BAF followed by combined morphine-Tat treatment for 24 h for western blot analyses of MAP1LC3B-II and SQSTM1 expression. The graphs represent densitometry from 3 independent experiments, mean+ SEM. (G and H) Modulation of morphine and Tat induced oxidative stress with autophagy inhibition and stimulation. Confluent HPMEC pretreated with either 3MA (10 mM) or rapamycin (10 nM) before morphine and Tat were assayed for (G) H2O2 and (H) O2− generation using amplex red and SOD-inhibitable cytochrome c reductase assays, respectively. Mean +SEM of at least 3 independent experiments. A, D, G) *P < 0.05, **P < 0.01, ***P < 0.001 vs. control, #P < 0.05, ##P < 0.01, ###P < 0.001 vs. morphine, $P < 0.05, $$P < 0.01, $$$0.001 vs. Tat, @P < 0.05, @@P < 0.01, @@@P < 0.001 vs. combined morphine and Tat (M+T). (B, C, F, H) *P < 0.001 vs. control, #P < 0.001 vs. morphine, $0.001 vs. Tat, @P < 0.001 vs. M+T treatment. Scale bars: 50 μm .