Figure 1.
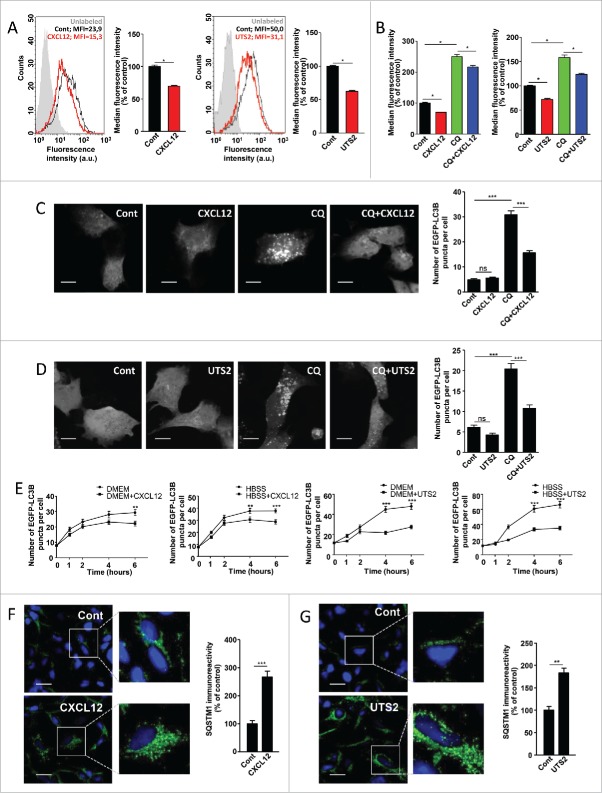
CXCR4 and UTS2R inhibit autophagosome biogenesis. (A) HEK-293 cells expressing CXCR4 (left panels) or UTS2R (right panels) were treated (24 h) with the respective ligands (CXCL12, 10−8 M; UTS2, 10−9 M). After treatment, cells were incubated with the Cyto-ID autophagy dye and fluorescence intensity was measured by flow cytometry. Data shown are cytometric profiles of a representative sample of each experimental group (10,000 cells per sample). a.u., arbitrary units; MFI, median fluorescence intensity; unlabeled, background signal without Cyto-ID incubation. Histograms show the average MFI ± SEM (n = 4; 10,000 cells per sample). (B) HEK-293 cells expressing CXCR4 (left panel) or UTS2R (right panel) were treated (24 h) with the respective ligands (CXCL12, 10−8 M; UTS2, 10−9 M), with or without chloroquine (CQ; 5 × 10⁻⁵ M), as indicated. After treatment, cells were incubated with the Cyto-ID autophagy dye and fluorescence intensity was measured by flow cytometry. Data are expressed as median fluorescence intensity ± SEM (n = 4; 10,000 cells per sample). (C) HEK-293 cells expressing CXCR4 and the fluorescent protein EGFP-LC3B were treated (6 h) with or without CXCL12 (10−8 M) and chloroquine (5 × 10⁻⁵ M), as indicated. Cells were fixed and the number of EGFP-LC3B fluorescent dots per cell was quantified on confocal images. Data represent means ± SEM, from at least 100 cells per group. Scale bars: 10 µm. (D) HEK-293 cells expressing UTS2R and the fluorescent protein EGFP-LC3B were treated (6 h) with or without UTS2 (10−9 M) and chloroquine (5 × 10⁻⁵ M), as indicated. Cells were fixed and the number of EGFP-LC3B fluorescent dots per cell was quantified as in (C). Scale bars: 10 µm. (E) Left 2 panels: HEK-293 cells expressing CXCR4 and the fluorescent protein EGFP-LC3B were pretreated (1 h) with chloroquine (5 × 10⁻⁵ M), then placed in either rich (DMEM, 10% serum) or nutrient-deprived (HBSS) media containing chloroquine, and treated with or without CXCL12 (10−8 M) for the indicated times. After incubations, cells were fixed and the number of EGFP-LC3B fluorescent dots per cell was quantified as in (C). Right 2 panels: HEK-293 cells expressing UTS2R and the fluorescent protein EGFP-LC3B were pretreated (1 h) with chloroquine (5 × 10⁻⁵ M), then placed in either rich (DMEM, 10% serum) or nutrient-deprived (HBSS) media containing chloroquine, and treated with or without UTS2 (10−9 M) for the indicated times. After incubations, cells were fixed and the number of EGFP-LC3B fluorescent dots per cell was quantified as in (C). (F) HEK-293 cells expressing CXCR4 were treated (6 h) with or without CXCL12 (10−8 M). Cells were fixed and labeled with an anti-SQSTM1/p62 antibody (green). For each photographic field, SQSTM1 immunoreactivity was quantified and normalized to the number of nuclei (DAPI stained, blue). Data represent means ± SEM from 10 photographic fields per group. Scale bars: 20 µm. (G) HEK-293 cells expressing UTS2R were treated (6 h) with or without UTS2 (10−9 M). Cells were fixed and SQSTM1 immunoreactivity was measured as in (F). Scale bars: 20 µm. Statistical significance was evaluated using a Mann and Whitney test (A, B, F, G) or an unpaired t test (C, D, E). *P < 0.05; **P < 0.01; ***P < 0.001; ns, not statistically different.

