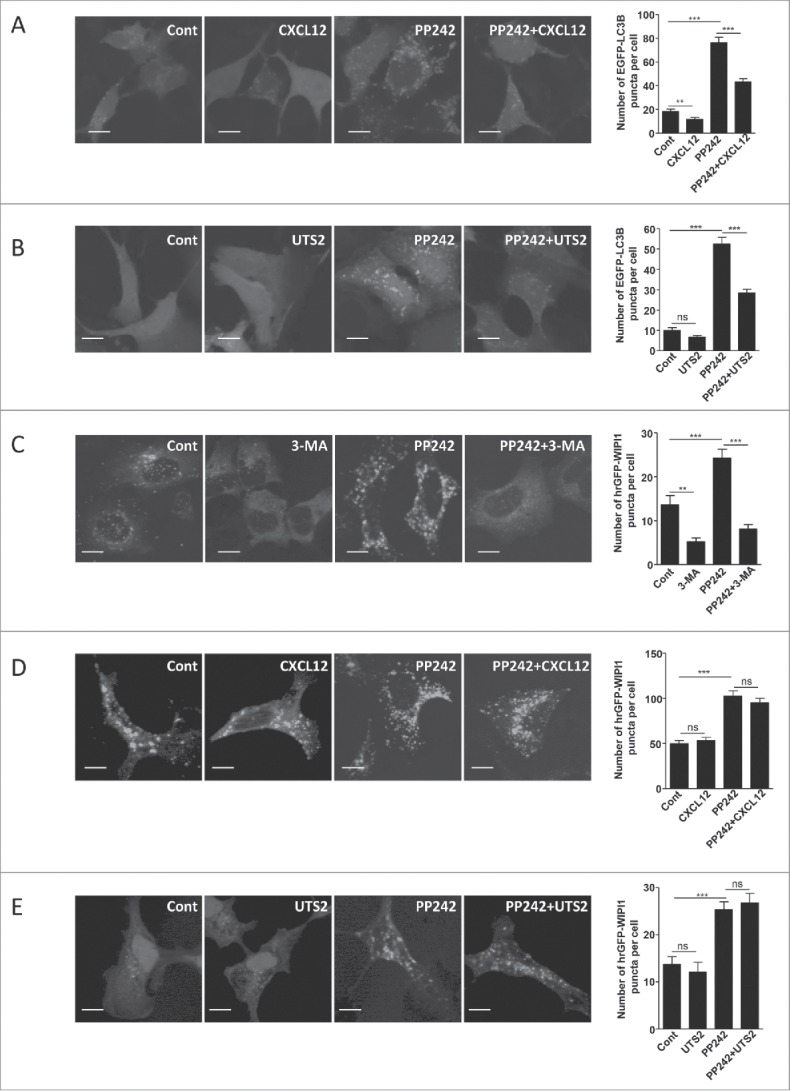
Figure 2.

CXCR4- and UTS2R-evoked inhibition of autophagy does not depend on regulation of MTOR kinase or recruitment of WIPI1 to the phagophore. (A) HEK-293 cells expressing CXCR4 and the fluorescent protein EGFP-LC3B were treated (6 h) with or without CXCL12 (10−8 M), and the MTOR inhibitor PP242 (10−6 M), as indicated. Cells were fixed and the number of EGFP-LC3B fluorescent dots per cell was quantified in confocal images. Data represent means ± SEM, from at least 100 cells per group. (B) HEK-293 cells expressing UTS2R and the fluorescent protein EGFP-LC3B were treated (6 h) with or without UTS2 (10−9 M), and the MTOR inhibitor PP242 (10−6 M), as indicated. Cells were fixed and the number of EGFP-LC3B fluorescent dots per cell was quantified as in (A). (C) HEK-293 cells expressing the fluorescent protein hrGFP-WIPI1 were treated (4 h) with or without 3-MA (10−2 M), a class III PtdIns3K inhibitor, and PP242 (10−6 M), as indicated. Cells were fixed and the number of hrGFP-WIPI1 fluorescent dots per cell was quantified on confocal images. Data represent means ± SEM, from at least 100 cells per group. (D) HEK-293 cells expressing CXCR4 and the fluorescent protein hrGFP-WIPI1 were treated (6 h) with or without CXCL12 (10−8 M) and PP242 (10−6 M), as indicated. Cells were fixed and the number of hrGFP-WIPI1 fluorescent dots per cell was quantified as in (C). (E) HEK-293 cells expressing UTS2R and the fluorescent protein hrGFP-WIPI1 were treated (6 h) with or without UTS2 (10−9 M) and PP242 (10−6 M), as indicated. Cells were fixed and the number of hrGFP-WIPI1 fluorescent dots per cell was quantified as in (C). Statistical significance was evaluated in all experiments using an unpaired t test. **P < 0.01; ***P < 0.001; ns, not statistically different. Scale bars: 10 µm.
