Figure 4.
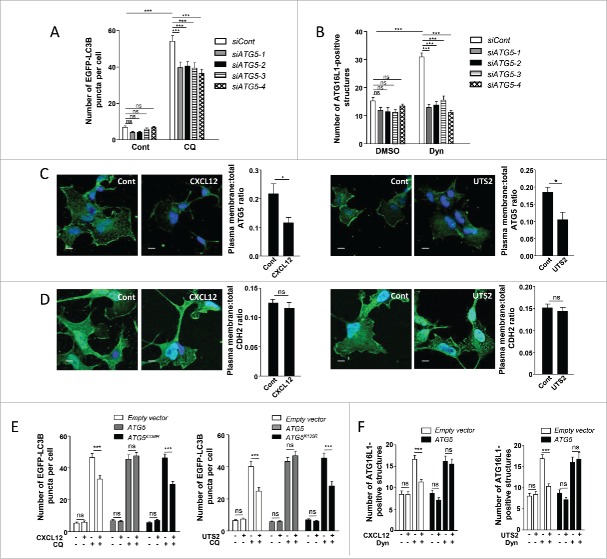
The anti-autophagic effects of chemotactic GPCRs depend on ATG5. (A) HEK-293 cells were transfected with a vector encoding EGFP-LC3B, together with one of the 4 siRNAs directed against ATG5 (siATG5-1, siATG5-2, siATG5-3 and siATG5-4) or with nontargeting siRNA (siCont). Cells were placed in DMEM without serum for 6 h with or without chloroquine (CQ; 5 × 10⁻⁵ M), fixed, and the number of EGFP-LC3B fluorescent dots per cell was quantified in confocal images. Data represent means ± SEM, from at least 100 cells per group. (B) HEK-293 cells transfected with one of the 4 siRNAs directed against ATG5 (siATG5-1, siATG5-2, siATG5-3, siATG5-4) or with nontargeting siRNA (siCont) were starved in HBSS for 1 h with or without Dynasore (Dyn; 10−4 M), fixed and labeled with an anti-ATG16L1 antibody. For each photographic field, the number of ATG16L1-positive structures was quantified and normalized to the number of nuclei. Data represent means ± SEM from 15 photographic fields per group. (C) HEK-293 cells expressing MYC-ATG5 together with CXCR4 (left panels) or UTS2R (right panels) were placed in DMEM without serum for 1 h with the respective ligands (CXCL12, 10−8 M; UTS2, 10−9 M). Cells were fixed and labeled with an anti-MYC antibody. For each photographic field, the fraction of MYC-ATG5 protein localized at the plasma membrane was evaluated. Data represent means ± SEM from 15 photographic fields per group. Scale bars: 10 µm. (D) HEK-293 cells expressing MYC-ATG5 together with CXCR4 (left panels) or UTS2R (right panels) were placed in DMEM without serum for 1 h with the appropriate ligand (CXCL12, 10−8 M; UTS2, 10−9 M). Cells were fixed and labeled with an anti-CDH2 antibody. For each photographic field, the fraction of CDH2 protein localized at the plasma membrane was evaluated. Data represent means ± SEM from 15 photographic fields per group. Scale bars: 10 µm. (E) HEK-293 cells were transfected with EGFP-LC3B, together with either ATG5, the ATG5K130R mutant or an empty vector, and either CXCR4 (left panel) or UTS2R (right panel). Cells were placed in DMEM without serum for 6 h with or without chloroquine (5 × 10⁻⁵ M) and CXCL12 (10−8 M, left panel) or UTS2 (10−9 M, right panel). Cells were fixed and the number of EGFP-LC3B fluorescent dots per cell was quantified as in (A). (F) HEK-293 cells were transfected with ATG5 or an empty vector together with CXCR4 (left panel) or UTS2R (right panel). Cells were starved in HBSS for 1 h with or without Dynasore (10−4 M) and CXCL12 (10−8 M, left panel) or UTS2 (10−9 M, right panel). Cells were fixed and the number of ATG16L1-positive structures was quantified as in (B). Statistical significance was evaluated using a Mann and Whitney test (B, C, D, F) or an unpaired t test (A, E). *P < 0.05; ***P < 0.001; ns, not statistically different.

