Figure 8.

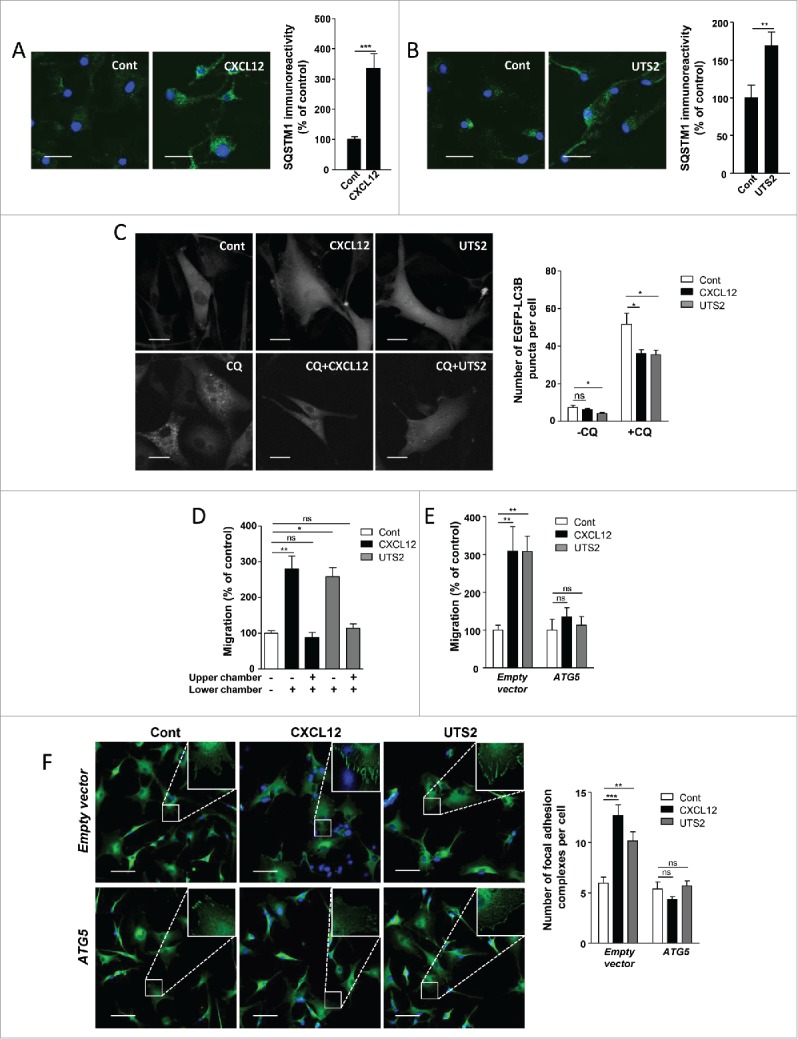
Inhibition of autophagy is required for chemotactic migration of U87 glioma cells. (A) U87 cells were treated (24 h) without (Cont) or with CXCL12 (10−8 M). Cells were fixed and labeled with an anti-SQSTM1/p62 antibody (green). For each photographic field, SQSTM1 immunoreactivity was quantified and normalized to the number of nuclei (DAPI stained, blue). Data represent means ± SEM from 20 photographic fields per group. Scale bars: 50 µm. (B) U87 cells were treated (24 h) without (Cont) or with UTS2 (10−8 M). Cells were fixed and SQSTM1 immunoreactivity was quantified as in (A). Scale bars: 50 µm. (C) U87 cells expressing the fluorescent protein EGFP-LC3B were treated (6 h) with or without CXCL12 (10−8 M), UTS2 (10−8 M) and chloroquine (CQ; 5 × 10⁻⁵ M), as indicated. Cells were fixed and the number of EGFP-LC3B fluorescent dots per cell was quantified in confocal images. Data represent means ± SEM, from at least 100 cells per group. Scale bars: 20 µm. (D) U87 cells were loaded in the upper chamber of transwells containing DMEM without serum, with or without CXCL12 (10−8 M) or UTS2 (10−8 M) in the lower or upper chamber, as indicated. After 24 h, cells that migrated onto the lower surface of the membrane were fixed, stained and counted. Data represent means ± SEM (n = 6). (E) U87 cells were transfected with an ATG5 expression vector or an empty vector. Cells were loaded in the upper chamber of transwells containing DMEM without serum, with or without CXCL12 (10−8 M) or UTS2 (10−8 M) in the lower chamber. After 24 h, cell migration was quantified as in (A). Data represent means ± SEM (n = 6). (F) U87 cells were transfected with ATG5 or an empty vector. Cells were then placed in DMEM without serum for 1 h in the absence (Control) or presence of CXCL12 (10−8 M) or UTS2 (10−8 M). Cells were fixed and adhesion complexes were labeled with an anti-VCL antibody (green). For each photographic field, adhesion complexes were quantified and normalized to the number of nuclei (DAPI stained, blue). Data represent means ± SEM from 15 fields per group. Scale bars: 50 µm. Statistical significance was evaluated using a Mann and Whitney test (A, B, D, E, F) or an unpaired t test (C). *P < 0.05; **P < 0.01; ***P < 0.001; ns, not statistically different.
