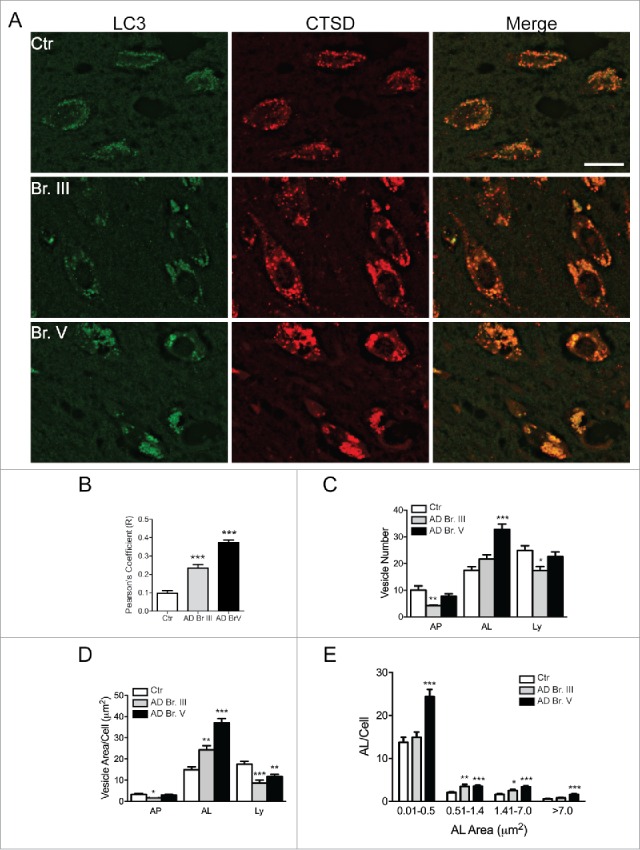
Figure 5.

Double-immunofluorescent labeling of the CA1 region with LC3 and CTSD. (A) Immunofluorescent staining for LC3 (green channel) and CTSD (red) in CA1 hippocampal neurons from Control, Br. III and V. Scale bar: 20 μm. (B) Pearson's correlation coefficient of colocalization of CTSD with LC3 in hippocampal CA1 neurons. A minimum of 100 neurons were quantified per condition. (C–D) Characterization of vesicles in Control, Br. III and V CA1 neurons, identified as autophagosome (AP, LC3-positive, CTSD-negative vesicles), autolysosome (AL, LC3- and CTSD-positive vesicles) and lysosome (Ly, LC3-negative, CTSD-positive vesicles). Depicted is the total number and area covered per cell in (C) and (D) respectively. (E) Size distribution of autolysosomes in Control, Br. III and V CA1 neurons. Statistical significance denoted by asterisks with p-values shown determined by one-way ANOVA, with post-hoc Dunnett's Comparison to Control test for grouped analyses, and 2-way ANOVA for size distribution analyses. *p ≤ 0.05; **p ≤ 0.01; ***p ≤ 0.001.
