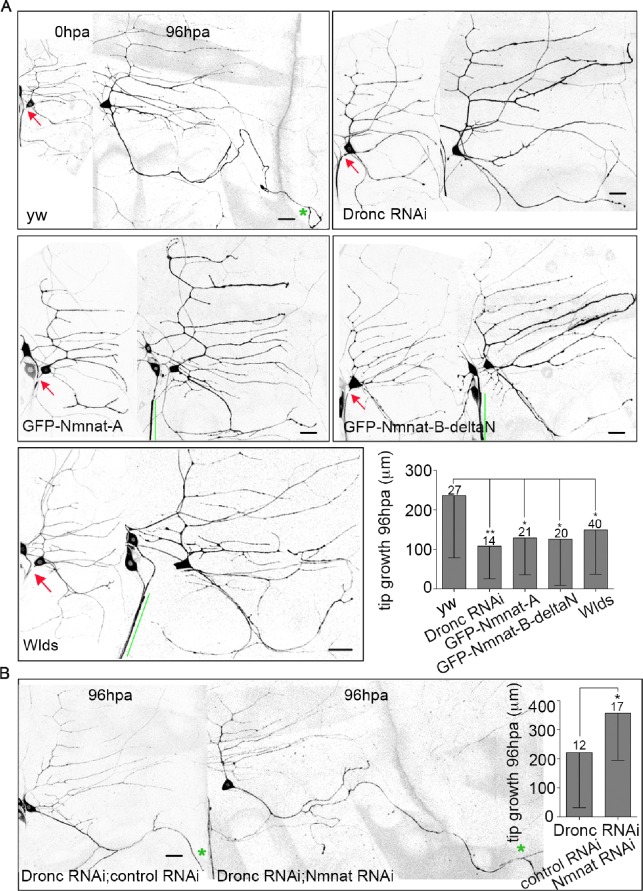
Fig 6. Excess Nmnat suppresses axon regeneration.
(A) Images of neurons of the indicated genotypes 0h and 96h after proximal axotomy are shown. The neurons are labeled with EB1-GFP. Red arrows indicate the site of axon injury. A green star marks the tip of the dendrite that converts to an axon after injury; all neurites that grew more than 50 microns have a star. Green lines mark cut off axons that have not degenerated. Scale bars are 20 μm. The average amount of tip growth (growth beyond the length increase due to growth of the whole animal) of the regenerating axon 96h after injury is shown in the graph. The numbers of neurons analyzed are indicated above the bars. Error bars, SD. See methods for statistics. Error bars represent SD. * p<0.05, ** p<0.01. (B) Axon regeneration of ddaE neurons co-expressing Dronc RNAi with a control RNAi or Nmnat RNAi was assayed. Green stars mark tips of the converted dendrites. The scale bar is 20 μm. Statistical significance was determined with an unpaired t test. * p<0.05. Error bar show SD. The numbers of neurons analyzed are indicated above the bars.

