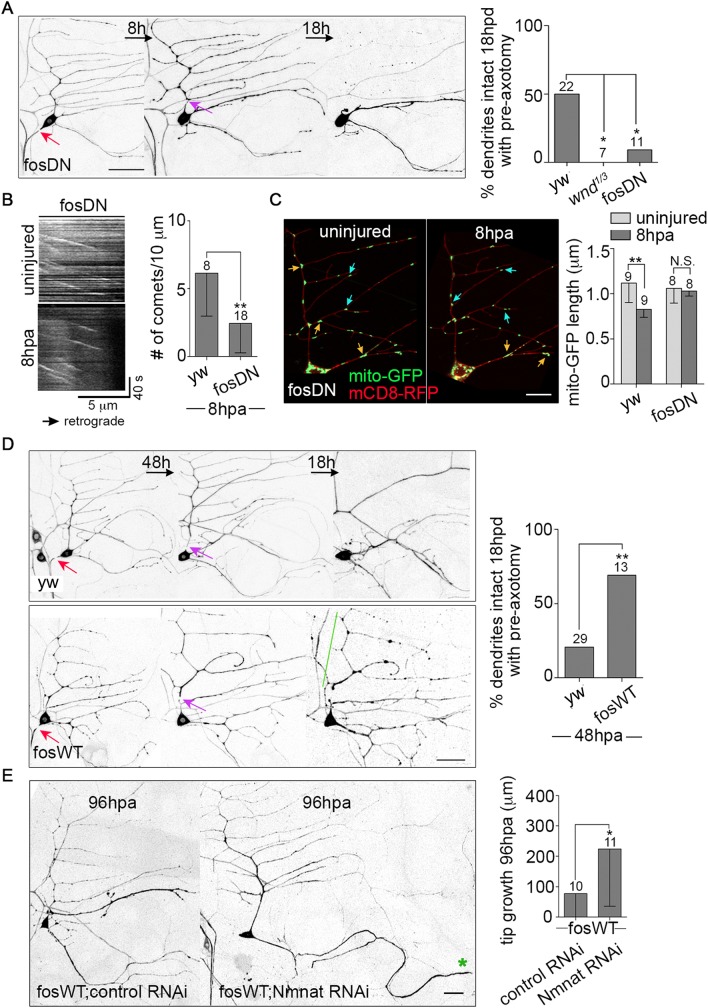
Fig 7. DLK/fos signaling coordinates neuroprotection and axon regeneration.
(A) Left, the NP assay was performed in fosDN-expressing neurons labeled with EB1-GFP. Red arrows point to the site of axon injury, purple arrows, dendrite injury. The scale bar is 50 μm. Right, quantification of NP is shown. The numbers of neurons analyzed are indicated above the bars, and control data is from Fig 2F. Statistical significance was determined with a Fisher’s exact test. * p<0.05. (B) Left, kymographs of EB1-GFP comets in fosDN-expressing neurons before and 8h after axon injury are shown. The graph at the right shows the quantification of microtubule dynamics in the ddaE comb dendrite 8h after axon injury. The numbers of neurons analyzed are indicated above the bars; control data is from Fig 4D. ** p<0.01, determined with an unpaired t test. Error bars are SD. (C) Left, mitochondria were imaged in the dendrites of fosDN-expressing neurons before and 8h post axon injury. mito-GFP (mitochondria) and mCD8-RFP (cell membrane) were expressed under the control of 221-Gal4. Orange and blue arrows indicate long (>1.5 μm) and medium (1–1.5 μm) mitochondria, respectively. The scale bar is 10 μm. Right, quantification of the average length of mitochondria in fosDN neurons is shown. Control data from Fig 2B is included for comparison. The numbers of neurons analyzed are indicated above the bars. A t test was used to test for significance. Error bars are SD. (D) Left, the NP assay was performed in WT and fos-overexpressing (fosWT) neurons as in (A), except that 48h elapsed between axon injury and dendrite injury rather than the 8h used elsewhere. Red arrows indicate the site of axon injury and purple arrows, dendrite injury. The green line marks a stabilized dendrite. The scale bar is 50 μm. Right, quantification of NP with the 48h gap between axon and dendrite injury is shown. The numbers of neurons analyzed are indicated above the bars. ** p<0.01, determined by Fisher’s exact test. (E) Left, images of neurons that co-express fosWT with a control RNAi or Nmnat RNAi at 96h post axon injury are shown. The green star marks the tip of the converted dendrite. The scale bar is 20 μm. Right, the average amount of regeneration was quantified and shown in the graph. The numbers of neurons analyzed were indicated above the bars. * p<0.05, determined by an unpaired t test. Error bars are SD.

