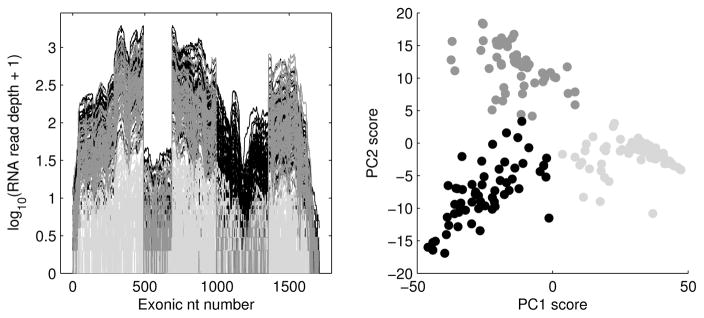
Figure 1.
PCA of RNAseq log read depth maps, for the union of exons in the gene CDKN2A. Left panel shows data curves. Right panel is the PC1 vs. Pc2 scores scatter-plot, showing three distinct clusters (brushed with gray levels). Use of these same colors in the left panel shows essentially unexpressed cases (lightest grey), and a clear alternate splicing event (other grey shades). This is an HDLSS example where PCA clearly reveals important biological structure.

