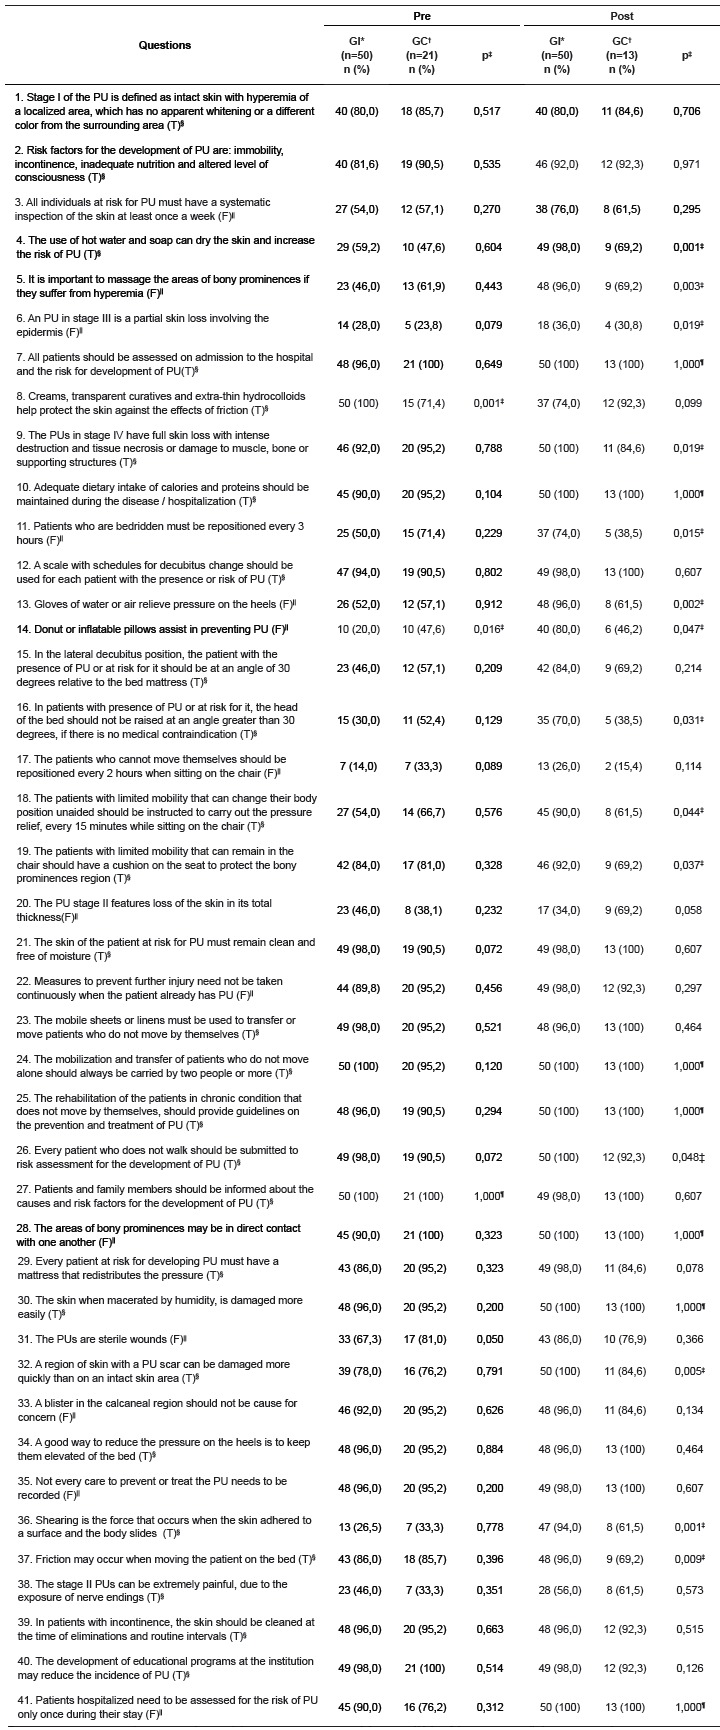
Table 2. Distribution of the percentage of correct answers of the groups according to the questions about staging, assessment and prevention, pre and post educational intervention. Vale do Rio Pardo e Jacuí region, RS, Brasil, 2014.

*IG = intervention group; †CG = control group ‡chi-square test, p<0,05; §(T) = true; ||(F) = false; ¶1,000 = all the answers with 100% accuracy
