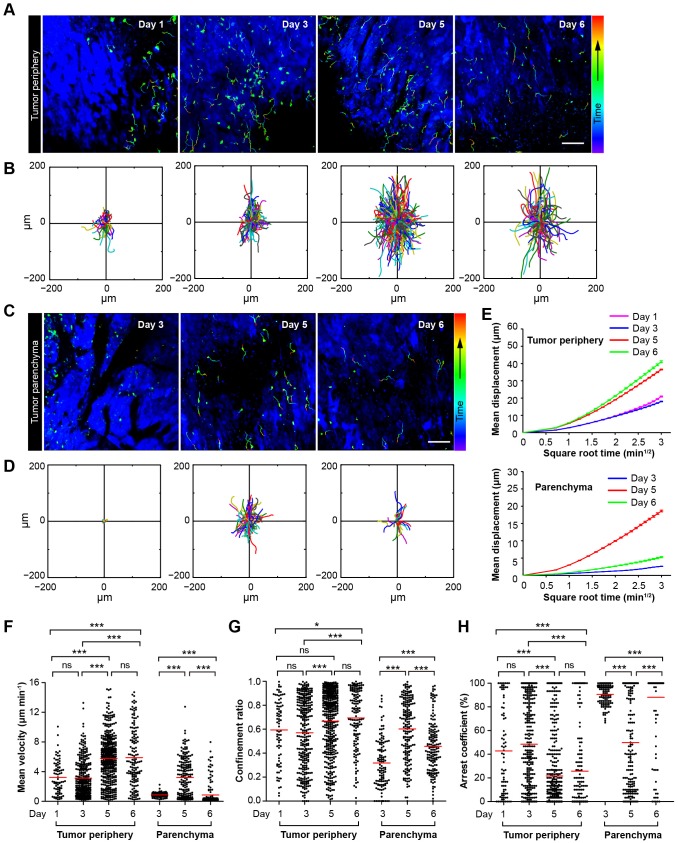
(A–D) Time-lapse images of CTLs with time-coded motion trajectories (color scale represents the duration). (A,C) Images of CTLs (green) at the periphery (near the blue area, A) or in the parenchyma (in the blue area, C) of the CFP-B16 tumors on different days after CTX-ACT treatment. Scale bar: 100 µm. (B,D) Trajectories of the individual CTLs at the periphery or in the parenchyma were plotted following the alignment of their starting positions. (E) Random walking analysis of the adoptive CTLs. Mean displacement (μm) versus the square root of the time (min1/2) of the CTLs at the periphery of (top) or in the parenchyma (bottom) on different days, (Figure 3—source data 1–9). (F–H) Scatter plots of (F) the mean velocity, (G) the confinement ratio, and (H) the arrest coefficient of the CTLs at the tumor periphery or in the tumor parenchyma on different days after CTX-ACT treatment. Each data point represents a single cell, and the red bars indicate mean values. *p<0.05, **p<0.01, ***p<0.001; ns – not significant, (Figure 3—source data 10). The data from 4–6 mice in three independent experiments were pooled.
DOI:
http://dx.doi.org/10.7554/eLife.14756.015
Figure 3—source data 1. Mean displacement (μm) versus the square root of the time (min1/2) of the CTLs at the tumor periphery on Day 1.Data listed in the excel files are displacements. Displacement is a function of time. Each column in the excel files lists displacements corresponding to one time. The time values are 0.5 min, 1 min, 1.5 min, and so on, in turn.
Figure 3—source data 2. Mean displacement (μm) versus the square root of the time (min1/2) of the CTLs at the tumor periphery on Day 3.
Figure 3—source data 3. Mean displacement (μm) versus the square root of the time (min1/2) of the CTLs at the tumor periphery on Day 5.
Figure 3—source data 4. Mean displacement (μm) versus the square root of the time (min1/2) of the CTLs at the tumor periphery on Day 6.
Figure 3—source data 5. Mean displacement (μm) versus the square root of the time (min1/2) of the CTLs in the tumor parenchyma on Day 3.
Figure 3—source data 6. Mean displacement (μm) versus the square root of the time (min1/2) of the CTLs in the tumor parenchyma on Day 5.
Figure 3—source data 7. Mean displacement (μm) versus the square root of the time (min1/2) of the CTLs in the tumor parenchyma on Day 6.
Figure 3—source data 8. Linear fitting results of MD (mean displacement) of adoptive CTLs at the tumor periphery on Day 1, Day 3, Day 5 and Day 6.
Figure 3—source data 9. Linear fitting results of MD (mean displacement) of adoptive CTLs in the tumor parenchyma on Day 3, Day 5 and Day 6.
Figure 3—source data 10. Scatter plots of the mean velocity, confinement ratio, and arrest coefficient of the adoptive CTLs at the tumor periphery or in the tumor parenchyma on different days.

