. 2016 Nov 18;5:e14756. doi: 10.7554/eLife.14756

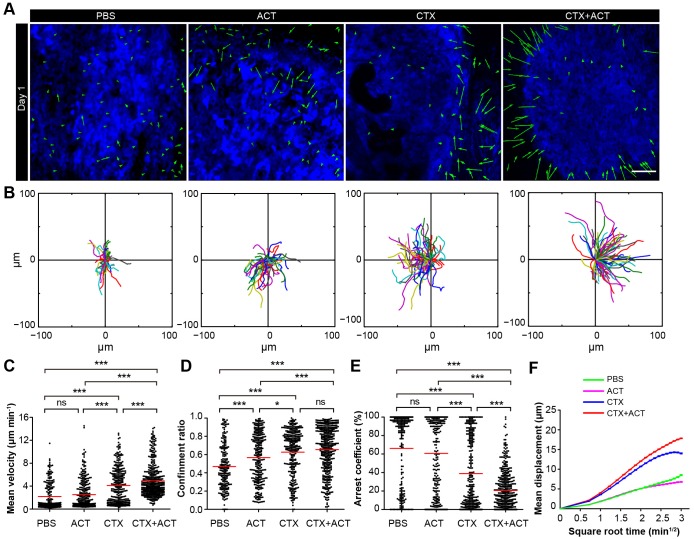
Figure 6. Migratory behavior of the TIIs following different treatments.

(A) In vivo time-lapse images of the EGFP TIIs in the CFP-B16 tumor area on Day 1. Mice were treated with ACT, CTX, CTX-ACT or PBS control. Green arrows represent TIIs displacement, and blue areas represent CFP-B16 tumors. Scale bar: 100 µm. (B) The trajectories of individual EGFP TIIs in different treated groups were plotted following the alignment of their starting positions. (CE) Scatter plots of the (C) mean velocity, (D) confinement ratio, and (E) arrest coefficient of the EGFP TIIs in the differently treated groups. Each data point represents a single cell, and the red bars indicate mean values. *p<0.05, **p<0.01, ***p<0.001; ns, not significant (Figure 6—source data 1). (F) Random walking analysis of the TIIs in the different groups. Mean displacement (μm) versus the square root of time (min1/2) of TIIs in different treatment groups ( Figure 6—source data 26). The data from 12–15 mice in three independent experiments were pooled.

DOI: http://dx.doi.org/10.7554/eLife.14756.044

Figure 6—source data 1. Scatter plots of the mean velocity, confinement ratio, and arrest coefficient of the EGFP TIIs in the different treatment groups.
DOI: 10.7554/eLife.14756.045
Figure 6—source data 2. Mean displacement (μm) versus the square root of the time (min1/2) of the TIIs in the PBS group. .
Data listed in the excel files are displacements. Displacement is a function of time. Each column in the excel files lists displacements corresponding to one time. The time values are 0.5 min, 1 min, 1.5 min, and so on, in turn. 
DOI: 10.7554/eLife.14756.046
Figure 6—source data 3. Mean displacement (μm) versus the square root of the time (min1/2) of the TIIs in the ACT group.
DOI: 10.7554/eLife.14756.047
Figure 6—source data 4. Mean displacement (μm) versus the square root of the time (min1/2) of the TIIs in the CTX group.
DOI: 10.7554/eLife.14756.048
Figure 6—source data 5. Mean displacement (μm) versus the square root of the time (min1/2) of the TIIs in the CTX-ACT group.
DOI: 10.7554/eLife.14756.049
Figure 6—source data 6. Linear fitting results of MD (Mean displacement) of TIIs at tumor areas in the different treatment groups on Day 1.
DOI: 10.7554/eLife.14756.050

Figure 6.

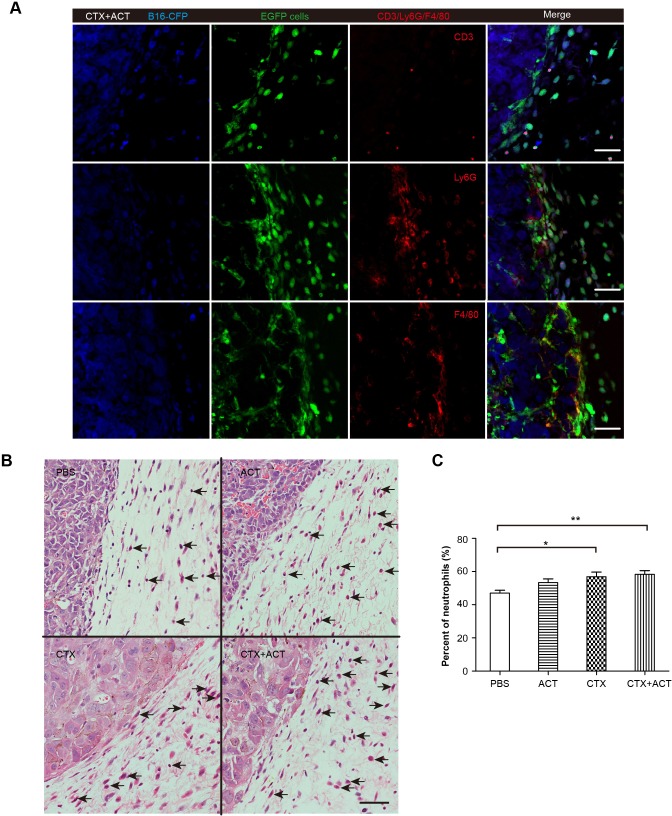
Figure 6—figure supplement 1. Phenotype of EGFP TIIs in CFP-B16 tumors of mice following different treatments.

Figure 6—figure supplement 1.

(A) Representative tumor sections stained with CD3, Ly6G and F4/80. Most of the EGFP TIIs at the tumor periphery were Ly6G+ and F4/80+. Scale bar: 50 μm. (B) Histopathology of HE-stained tumor sections from tumor-bearing mice exposed to different treatments. Black arrows indicate neutrophils. Scale bar: 50 μm. (C) Percentage of neutrophils among TIIs at the periphery of the tumors in mice that received different treatments. The data are represented as the mean ± SEM (n = 14–20 fields) results from three mice per group. *p<0.05, **p<0.01, (Figure 6—figure supplement 1—source data 1).
Figure 6—figure supplement 1—source data 1. Percentage of neutrophils among TIIs at the periphery of the tumors in mice that received different treatments.
DOI: 10.7554/eLife.14756.052