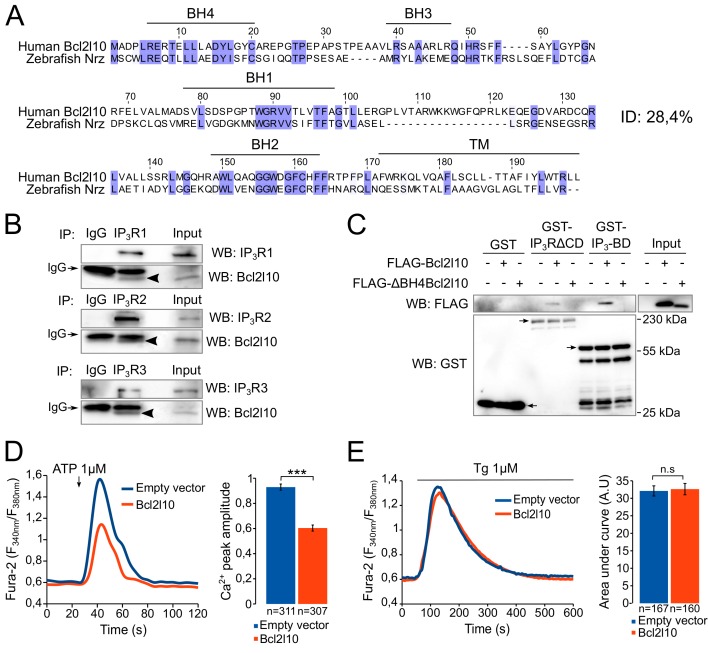
Figure 1. Bcl2l10 interacts with and regulates IP3R.
(A) Clustal Omega alignment of human Bcl2l10 and zebrafish Nrz primary structures. Identical residues are boxed in blue. The positions of conserved Bcl-2 homology (BH) domains and of the C-terminal transmembrane (TM) domain are indicated. (B) Western blot of immunoprecipitation (IP) between the three endogenous IP3R isoforms (IP3R1, IP3R2 and IP3R3) and endogenous Bcl2l10. IgG antibodies are indicated by arrows. Arrow heads indicate bands corresponding to Bcl2l10 in IP. Western blots are representative of three independent experiments. (C) Western blot of GST-pulldown performed with GST, GST-IP3R∆CD or GST-IP3BD on lysates of HeLa cells expressing FLAG-Bcl2l10 or FLAG-∆BH4Bcl2l10. Arrows indicate the bands corresponding to GST, GST-IP3R∆CD and GST-IP3BD. Western blot representative of three independents experiments. (D) Left panel: representative Ca2+ response curve of Fura-2-loaded cells stimulated with 1 µM ATP at the indicated times. Cells were transfected with empty vector or FLAG-Bcl2l10. Basal Fura-2 F340 nm/F380 nm = 0.61 ± 0.01 and 0.59 ± 0.01 for empty vector and Bcl2l10 cells, respectively. Right panel: Bar graph showing the mean amplitude (±SEM) of the ATP-induced Ca2+ peak (n: number of cells analyzed from five independent experiments). (E) Left panel: representative response curve of Fura-2-loaded cells treated with 1 µM thapsigargin at the indicated times. Right panel: Bar graph showing the mean area under curve (AUC) (±SEM) of the thapsigargin-induced Ca2+ peak (n: number of cells analyzed from three independent experiments). ***p<0.001; n.s p>0.05.

