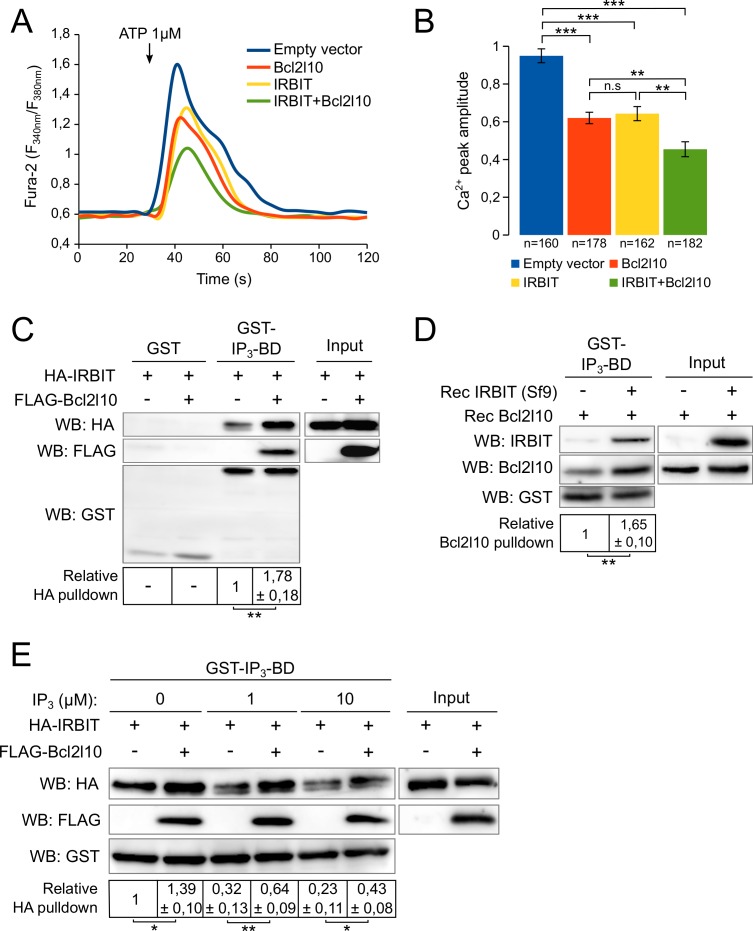
Figure 2. IRBIT and Bcl2l10 cooperate to regulate IP3R activity.
(A) Representative Ca2+ response curve of Fura-2-loaded IRBIT KO MEF cells stimulated with 1 µM ATP at the indicated times. Cells were transfected with empty vector or with a plasmid expressing either FLAG-Bcl2l10 or FLAG-IRBIT alone, or FLAG-Bcl2l10 and FLAG-IRBIT together. Basal Fura-2 F340 nm/F380 nm = 0.61 ± 0.01, 0.59 ± 0.01, 0.59 ± 0.01 and 0.58 ± 0.01 for empty vector, Bcl2l10, IRBIT and Bcl2l10+IRBIT, respectively. (B) Bar graph showing the mean amplitude (±SEM) of the ATP-induced Ca2+ peak (n: number of cells analyzed from five independent experiments). (C) Western blot of GST-pulldown performed with GST or GST-IP3BD on lysates of HeLa cells expressing HA-IRBIT alone or in combination with FLAG-Bcl2l10. Quantification was performed from three independent experiments. (D) Western blot of GST-pulldown performed with GST-IP3BD on recombinant Bcl2l10 alone or in combination with recombinant IRBIT produced in Sf9 cells. Quantification was performed from three independent experiments.(E) Western blot of GST-pulldown performed with GST-IP3BD on lysates of HeLa cells expressing HA-IRBIT alone or in combination with FLAG-Bcl2l10 in the presence of 0, 1 or 10 µM IP3. Quantification was performed from three independent experiments. *p<0.05, **p<0.01, ***p<0.001.

