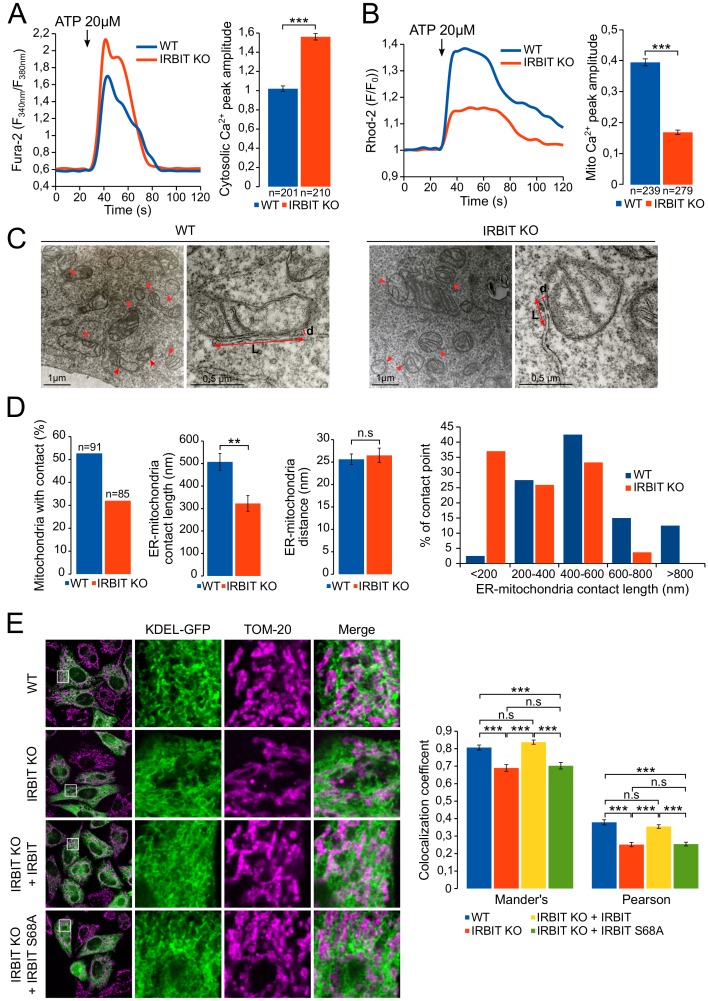
Figure 7. IRBIT promotes ER-mitochondria Ca2+ transfer and contact.
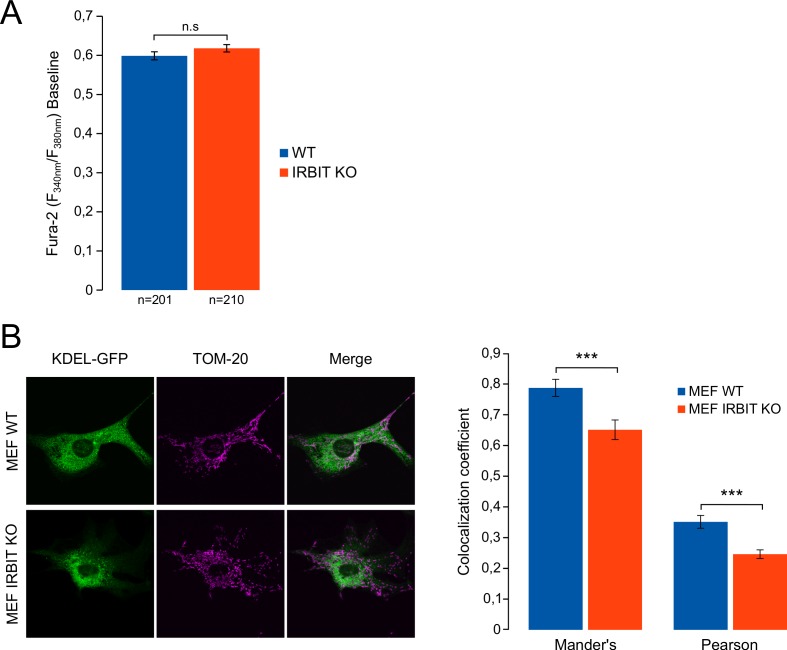
(A) Left panel: representative Ca2+ response curve of Fura-2 loaded WT or IRBIT KO MEF cells stimulated with 20 µM ATP at the indicated times. Right panel: Bar graph showing the mean amplitude (±SEM) of the ATP-induced Ca2+ peak (n: number of cells analyzed from three independent experiments). (B) Left panel: representative Ca2+ response in the mitochondria of Rhod-2-loaded WT or IRBIT KO MEF cells stimulated with 20 µM at the indicated times. Right panel: bar graph showing the mean amplitude (±SEM) of the ATP-induced Ca2+ peak in the mitochondria (n: number of cells analyzed from three independent experiments). (C) Representative electronic microscopy images of WT and IRBIT KO HeLa cells. Red arrows indicate contact points between ER and mitochondria. Red double-headed arrows indicate the length of the ER-mitochondria contact (L) and the distance between ER and mitochondria (d). (D) Quantitative analysis of ER-mitochondria contacts observed by electronic microscopy in WT and IRBIT KO HeLa cells. Bar graphs show the percentage of mitochondria in contact with ER (n = three cells analyzed per condition. WT – 91 mitochondria, IRBIT KO – 85 mitochondria), the mean length (±SEM) of ER–mitochondria contact, the mean distance (±SEM) between ER and mitochondria at contact points and the percentage of ER-mitochondria contact points measuring the indicated length (n = three cells analyzed per condition; WT – 48 mitochondria, IRBIT KO – 27 mitochondria). (E) Left panel: immunofluorescence of WT and IRBIT KO HeLa cells transfected with an ER marker (KDEL-GFP (green)) and stained with anti-TOM20 antibody (magenta) for mitochondria labelling. WT cells were also transfected with empty vector and IRBIT KO cells with empty vector or with a vector expressing FLAG-IRBIT or FLAG-IRBIT S68A. Areas shown in close-up highlight ER-mitochondria contact sites. Right panel: Bar graph showing the mean Mander’s overlap coefficient (±SEM) and the mean Pearson coefficient (±SEM) of WT and IRBIT KO cells expressing the indicated protein (n = three independent experiments, ~20 cells analyzed per condition for each experiment). *p<0.05, **p<0.01, ***p<0.001. See also Figure 7—figure supplement 1.


