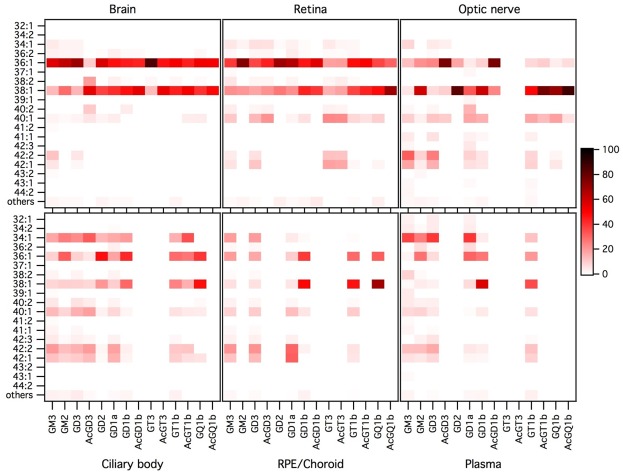
Fig 4. Molecular species profile of the ganglioside classes of the retina and other ocular tissues, brain and plasma.
Data (peak areas) were obtained by operating the QqQ mass spectrometer in negative SRM mode. The proportion of each ceramide species was expressed, as percentage, relatively to the sum of all detected species in its specific GG class, every GG class being considered separately. Molecular species accounting for less than 1% were grouped under the category “others”. Results were expressed as mean of 4 to 7 independent samples for each tissue, injected three times. The color intensity of a spot on the graph is proportional to the mean percentage of the ceramide species considered within a GG class.

