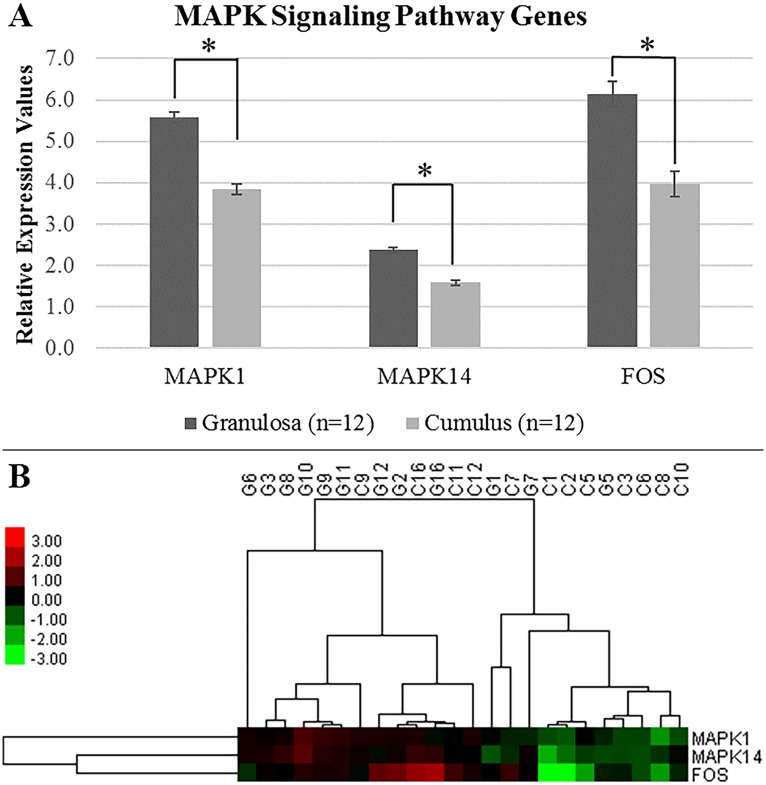
Fig 5. Relative expression values and heatmap figure of MAPK signaling pathway-related genes.
(A) Relative expression values obtained from qRT-PCR analysis for each gene are shown on the y-axis in arbitrary units. The data were obtained from 12 independent PCOS patients. Each patient provided both cell types, CC and MGC. The data are presented as mean ± SEM. Asterisk (*) indicates a significant difference (p<0.05) in gene expression between granulosa and cumulus cells. (B) Hierarchical clustering analysis was performed with qRT-PCR data. The CCs (C) and MGCs (G) were grouped according to the expression profiles of three MAPK signaling genes. Their expression levels were lower in CCs than MGCs.

