
Figure 2. Quantitative analysis of 2D-PAGE.
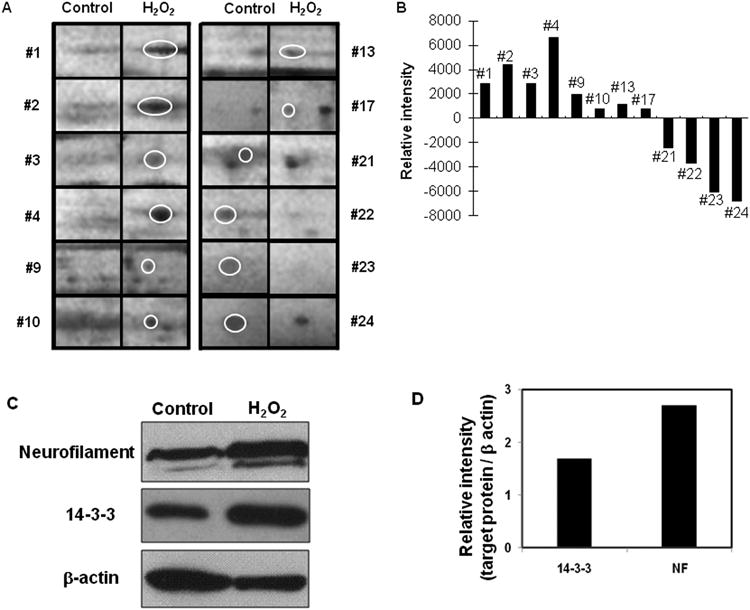
(A) Magnified protein spots in oxidative stress are shown with the control. (B) Each protein spots were analyzed based on volume and intensity. (C) Western blot analysis of 14-3-3 and neurofilament in control (lane 1) and H2O2 treated (lane 2) bovine RPE cells. (D) Quantification of western blot shows that 14-3-3 and neurofilament in oxidative stress were up-regulated by 1.8 fold and 2.8 fold compared to control.