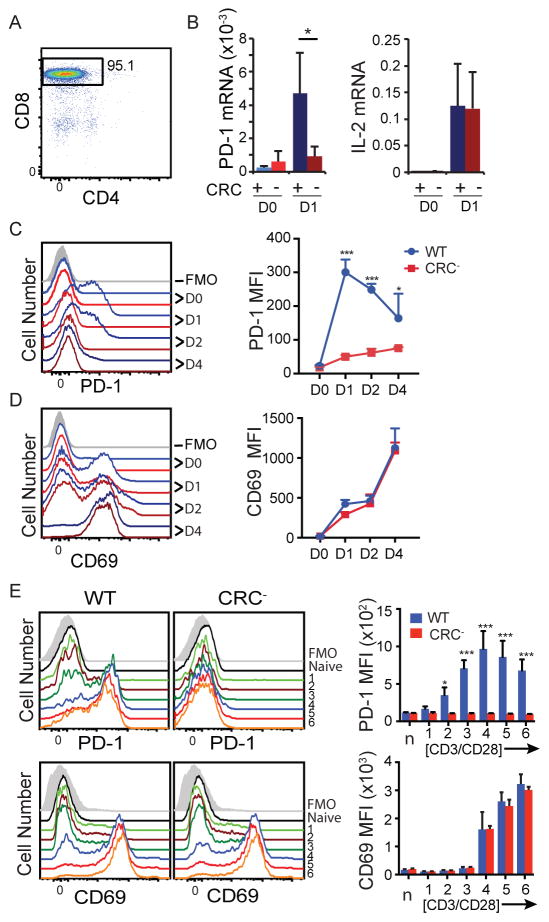
Figure 2. CRC is necessary for PD-1 expression during ex vivo stimulation.
A) Representative enrichment by MACS of CD8 T cells from total splenocytes used for ex vivo experiments. B–D) Enriched CD8 T cells were stimulated with CD3/CD28 antibodies. B) mRNA was harvested at 0 and 24 hours, and analyzed by real-time PCR. Values for Pdcd1 and IL2 mRNA are graphed as a percentage of 18s rRNA. C and D) Cells were harvested at 0, 24, 48, and 96 hours after stimulation as above and stained for flow cytometry. Representative plots (left) and MFI (right) at each time point are shown for PD-1 (C) and CD69 (D). Data are graphed as mean plus standard deviation, and represent six independent experiments. E) Naïve CD8 T cells were enriched by MACS and stimulated with the following doses of anti-CD3/CD28 antibodies: 0.04/0.08 μg/ml (1), 0.2/0.4 μg/ml (2), 1/2 μg/ml (3), 2.5/5 μg/ml (4), 5/10 μg/ml (5), and 10/20 μg/ml (6). Cells were harvested at 24 h after stimulation and stained for flow cytometry. Representative flow plots for both WT and CRC− cells are shown on the left, and average plus standard deviation from three independent replicates is graphed to the right. Panel B used a Student’s T test and Panels C, D, and E used a two-way ANOVA to determine statistical significance. * P< 0.05; *** P<0.001

