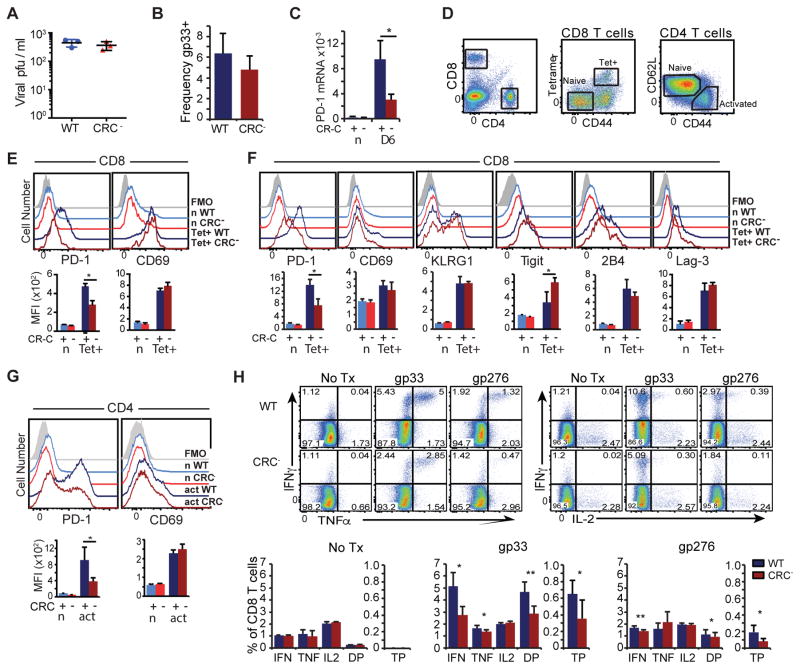
Figure 3. Acute viral infection induces PD-1 through CR-C.
A) Frequency of LCMV gp33-specific CD8 T cells as a percentage of total CD8 T cells from WT (Blue) or CRC− (Red) mice day 6 PI with LCMV Armstrong. B) Viral titers in the serum of LCMV Armstrong infected animals at day 4. C) PD-1 mRNA as a % of 18s rRNA from virus-specific CD8 T cells collected from WT (blue) and CR-C (red) mice infected with LCMV Armstrong at days 0 and 6. D) Gating strategy showing naïve (n) and tetramer+ (Tet+) populations of CD8 T cells, or naïve (n) and activated (act) populations of CD4 T cells. Representative flow cytometry histograms and quantification of MFIs from CD8 T cells collected from WT or CRC− mice at day 4 (E) or day 6 (F). Flow analysis of CD4 T cells at Day 6 PI is shown in (G). H) CD8 T cells from day 6 LCMV Armstrong infected mice were stimulated with no peptide, gp33, or gp276 ex vivo in the presence of brefeldin A for 5 hours. Frequency of IFNγ, TNFα, and IL-2 single positive cells, cells expressing any two cytokines (DP), and triple positive (TP) cells as a proportion of all CD8 T cells were graphed below. For panels A, B, C, D, F, and G, four groups of 3 or more mice/genotype were used. For panels E and H, two groups of 3 mice per genotype were used. Graphs represent mean plus standard deviation for individual representative experiments. Student’s T test was used to determine significance with * P< 0.05; ** P<0.01.

