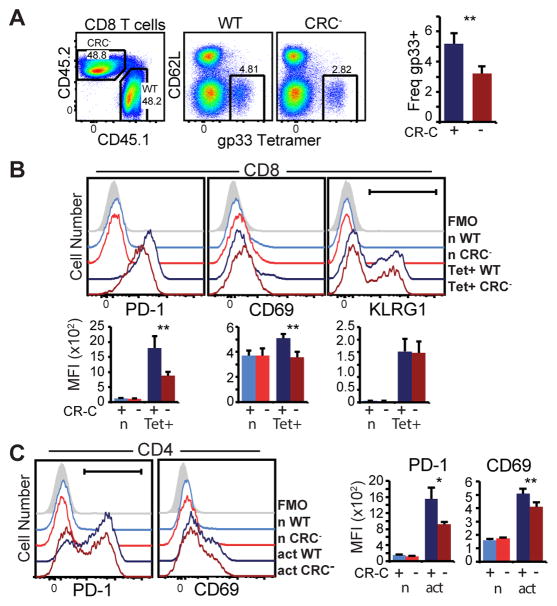
Figure 4. Changes to PD-1 expression in CR-C mice are cell intrinsic.
Bone marrow chimeras were established in RAG−/ − mice irradiated with 500 rads. 107 WT (CD45.1) or CRC− (CF45.2) bone marrow cells from the femurs of healthy mice were adoptively transferred into irradiated hosts. 6 weeks after transfer, mice were bled to ensure chimerism and then infected with LCMV Armstrong. Splenocytes from infected animals were analyzed at day 6 post infection. A) Flow cytometry plots showing WT (CD45.2) and CRC− (CD45.1) CD8 T cells in chimeric animals at day 6, and gp33 tetramer-specific cells within each population. The frequency of virus-specific cells in WT (CRC+) and CRC- populations within each chimera are shown to the right. B) Flow cytometry histograms (top) and average MFI (bottom) in naïve (CD44+ CD62L−) or virus-specific CD8 T cells within WT (CD45.1) or CRC− (CD45.2) populations. C) Flow cytometry histograms for CD4 cells from the above animals. Two groups of 3–4 host mice with independent donors of each genotype were used for these experiments. Mean and standard deviation of a representative experiment is graphed. Paired Student’s T test was used to calculate significance. * P< 0.05; ** P<0.01

