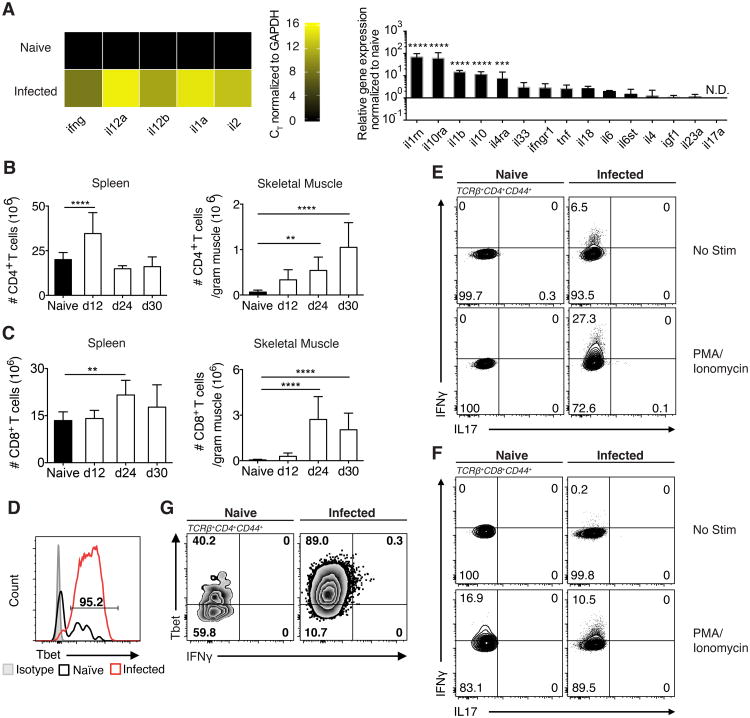
Figure 2. Inflammatory landscape of infected skeletal muscle is highly Th1-polarized.
(A) Inflammatory targets involved in known musculoskeletal disease pathways were explored by screening RNA isolated from the skeletal muscle of naïve mice and mice 30 dpi against 379 unique targets by qRT-PCR. Left: Heatmap was generated from CT values of targets normalized to housekeeping (GAPDH) from naïve and infected mice. Right: Relative gene expression of infected skeletal muscle targets normalized to housekeeping and naïve skeletal muscle. Statistics were calculated on log-transformed fold change values. (B,C) Quantification of (B) TCRβ+CD4+ T cells and (C) TCRβ+CD8+ T cells in spleen and skeletal muscle after infection (D) Representative FACS plots of Tbet expression by Tconv (TCRβ+CD4+Foxp3-CD44+) in naïve and infected muscle (30 dpi). (G) Representative FACS plots of Tbet and IFNγ by Tconv from naïve and infected muscle ex vivo (60 dpi.). (E,F) Representative FACS plots of IL-17 and IFNγ production by (E) Tconv and (F) CD44+CD8+ T cells from naïve and infected muscle following 3-hour PMA/Ionomycin stimulation (24 dpi.). (A-F) Results are representative of at least three experiments with n = 4 mice per group/experiment; error bars are the SD. **P < 0.01; ***P <0.001; ****P < 0.0001; (A) ANOVA with Tukey's multiple comparisons test (B,C) Student's t test.

