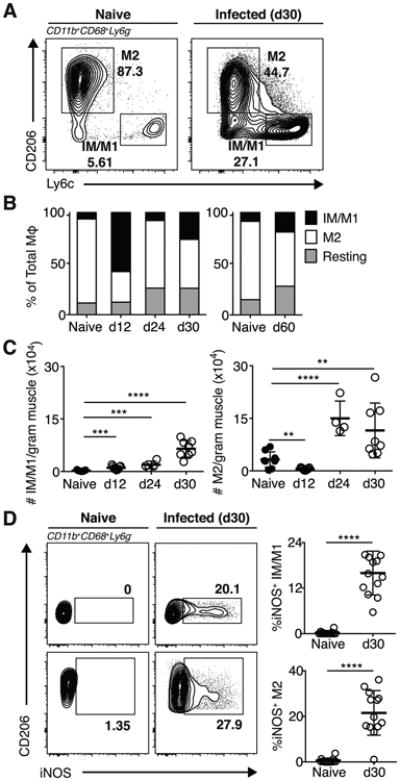
Figure 3. T. gondii infection expands IM/M1 populations.

(A) Gating scheme for IM/M1 and M2 MΦ were gated on CD45+CD11b+Ly6G-CD68+ cells.(B) Frequencies and (C) absolute numbers of IM/M1 (Ly6ChiCD206lo), M2 (Ly6CloCD206hi), and resting (Ly6CloCD206lo) MΦ in naïve and infected muscle. (A-B) Results are representative of at least two experiments with n ≥ 4 mice per group/experiment; error bars are the SD. (D) Representative FACS plots and graphical representation of iNOS expression by muscle IM/M1 and M2 in naïve and infected mice. Results are representative of at least four experiments with n = 4 mice per group/experiment. **P < 0.01; ***P < 0.001; ****P < 0.0001; (C) ANOVA with Tukey's multiple comparisons test, (D) Mann-Whitney U test.
