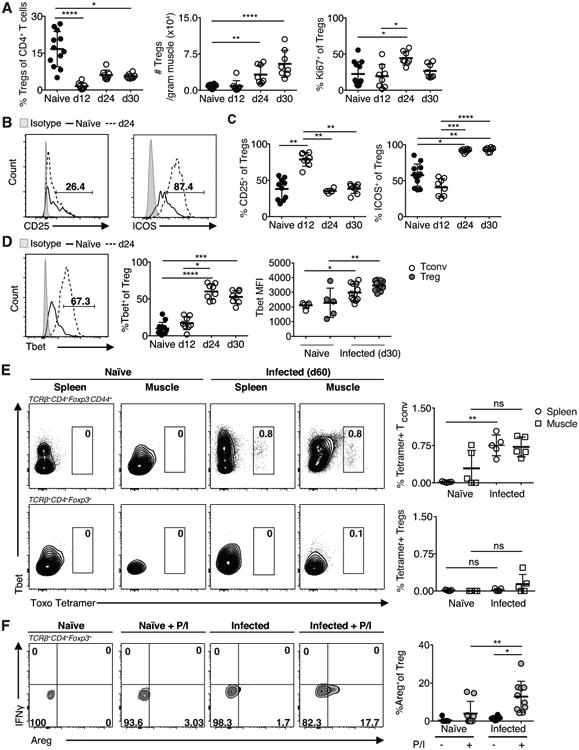
Figure 4. Treg kinetics and phenotype during chronic infection.

(A) Quantification of Treg (TCRβ+CD4+Foxp3+) frequency, absolute number and proliferation (KI67+) during infection. (B) Representative FACS plots (C) and graphical summary of CD25 and ICOS expression in Tregs from naïve and infected (24-days p.i.) muscle. (D) Left and middle: Representative FACS plots and graphical summary of Tbet expression in skeletal muscle Tregs during infection. Right: Tbet MFI in Tconv and Treg 30 dpi. (E) Representative FACS plots and graphical summaries of antigen specific CD44+CD4+Tconv and Tregs in the spleen and skeletal muscle during long-term infection as detected by staining with MHC class II tetramers loaded with T. gondii antigenic peptide (F) FACS plots and graphical representation of Areg expression by Tregs isolated from naïve and infected (24-days p.i.) muscle following 3-hour PMA/Ionomycin (P/I) restimulation. Results are representative of at least three experiments with n ≥ 4 mice per group/experiment; error bars are the SD. *P < 0.05; **P < 0.01; ***P < 0.001; ****P < 0.0001; Kruskal-Wallis test.
