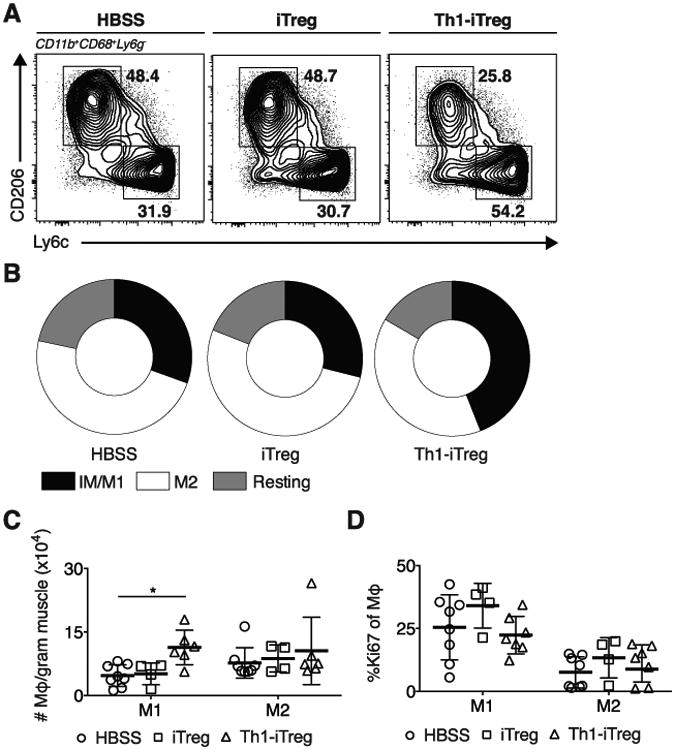
Figure 5. Th1-iTreg Transfer increases M1 populations.

HBSS, iTregs, or Th1-iTreg were adoptively transferred into infected mice 23 dpi. (A) Representative FACS plots, (B) Distribution and (C) absolute number of IM/M1, M2 and resting MΦ six days after cell-transfer. (D) Effect of Treg transfer on skeletal muscle M1 and M2 proliferation (Ki67+) six days following transfer. Results are representative of n ≥ 5 per group from two experiments, error bars are the SD. *P < 0.05; Student's t test.
