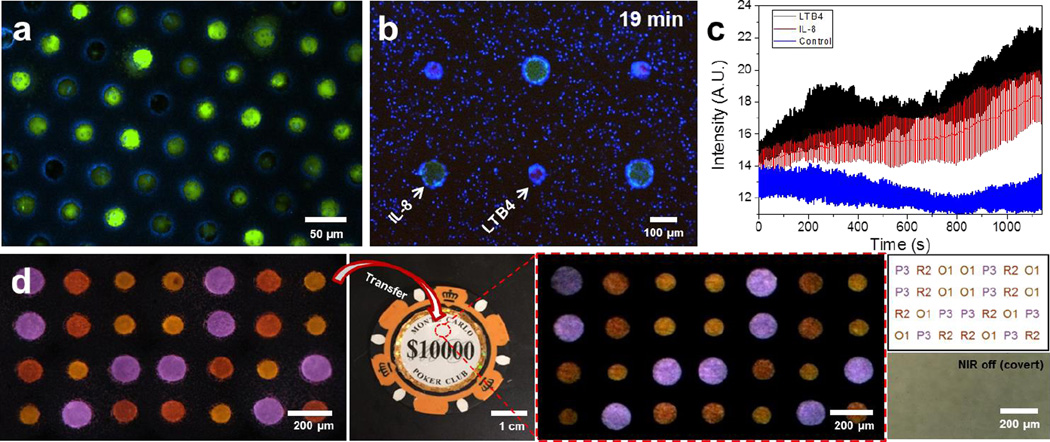
Figure 5. Application of large scale microwell arrays.
a, High throughput single-cell arrays using glioma cell line (U87) and porous microwells. Cells that are slightly larger than a microwell are squeezed into the microwells. Cells that are smaller than the microwells remain trapped inside the microwells after the washing step. b–c, Larger particles (green), loaded with protein chemoattractant IL-8, and smaller particles (red), loaded with leukotriene chemoattractant LTB4, are arranged in a regular, alternate pattern using LMSA. Human neutrophils (blue) navigate in the heterogeneous microenvironment created by the diffusion of the two chemoattractants from the particles. b, Neutrophils accumulate preferentially around the LTB4 source-particles after 19 minutes. c, Neutrophil accumulation is quantified by the change in average intensity around source-particles over time (blue fluorescence channel). Neutrophil accumulation is slightly faster around LTB4 than IL-8 particles. Control is a region of the array with no particles. Error bars represent standard deviation (n = 3). d, Anti-counterfeiting demonstration. Sequentially assembled 4×7 code was transferred to a target object (poker chip) and decoded into a text form. From the left, images show sequentially assembly UCN-laden microparticles, surface encoded object (poker chip), transferred particle arrays under NIR exposure, decoded results in a text form (top), and bight field image of encoded area (red circled area on poker chip). In decoding results, the alphabet character and number represents color (Table S4) and size of the particles, respectively.

