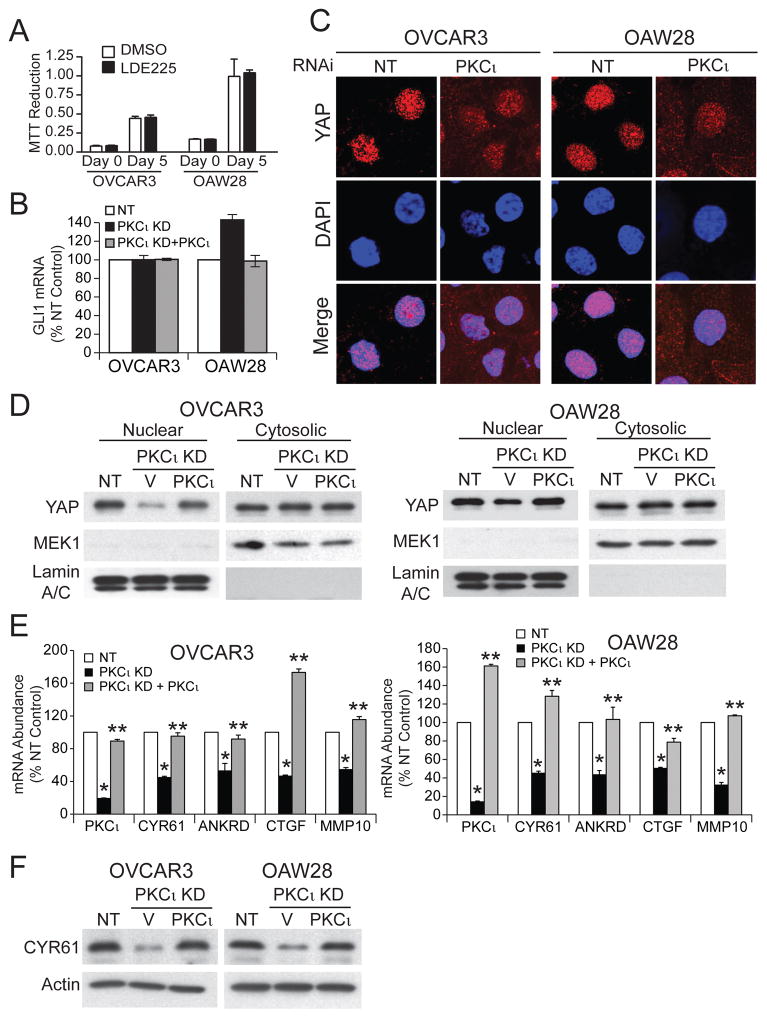
Figure 2. PKCι modulates nuclear YAP1.
A. Effect of the SMO inhibitor LDE225 (1 μM) on growth of OSC cells was assessed by MTT assay. Results presented as MTT reduction +/−SEM. N=5. B. Effect of PKCι KD and exogenous PKCι on GLI1 expression in OSC cells. Results represent GLI1 RNA abundance expressed % NT control +/− SEM. N=3. C. Immunofluorescence detection of YAP1 (red) and nuclei (DAPI; blue) in NT and PKCι KD OSC cells. D. Immunoblot analysis of nuclear and cytoplasmic extracts of NT, and PKCι KD cells expressing control vector or PKCι for YAP1. MEK1 and Lamins A/C serve as cytoplasmic and nuclear controls respectively. Results are representative of three independent experiments. E. QPCR analysis for expression of PKCι, CYR61, ANKRD1, CTGF and MMP10 mRNA in NT and PKCι KD cells expressing either control vector or PKCι. Results expressed as % NT control. N=3. *p<0.05 compared to NT; **p<0.05 compared to PKCι KD. F. Immunoblot analysis of total cell lysates from NT, and PKCι KD cells expressing control vector or PKCι for CYR61. Actin serves as a loading control. Results are representative of two independent experiments.

