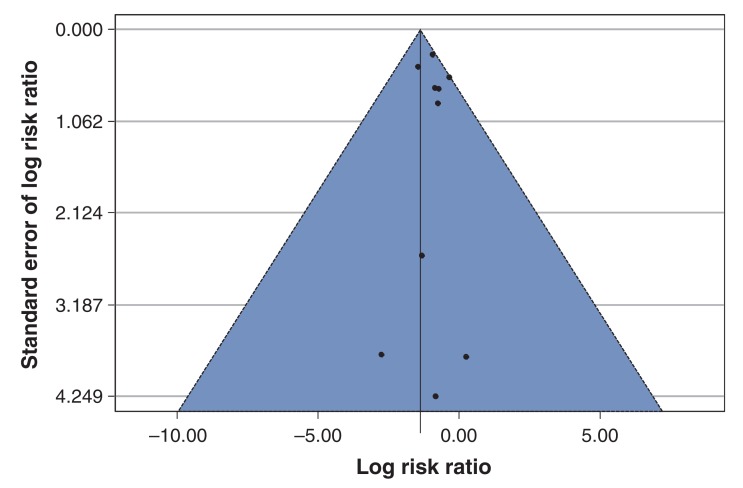
Figure 4.
Funnel plot of studies included in meta-analysis of Lactobacillus treatment in prevention of Clostridium-difficile-associated diarrhea. The solid line in the centre is at the pooled log risk ratio from the Bayesian meta-analysis with the vague prior distribution. The two dashed lines on either side demarcate a 95% pseudo confidence region.

