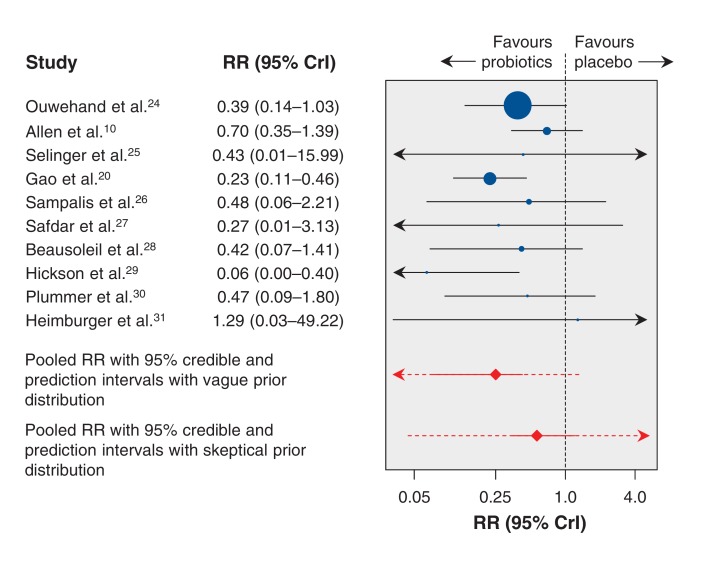
Figure 5.
Forest plot summarizing results of Bayesian hierarchical meta-analysis. The plot shows the pooled risk ratio (red diamond) and 95% credible interval (solid red line) and 95% prediction interval (dotted red line) estimated by means of a Bayesian meta-analysis with a vague prior distribution, and the pooled risk ratio and 95% credible and prediction intervals from a Bayesian meta-analysis with a critical skeptical prior distribution. Values less than 1.0 favour Lactobacillus probiotics. CrI = credible interval, RR = risk ratio.

