Figure.

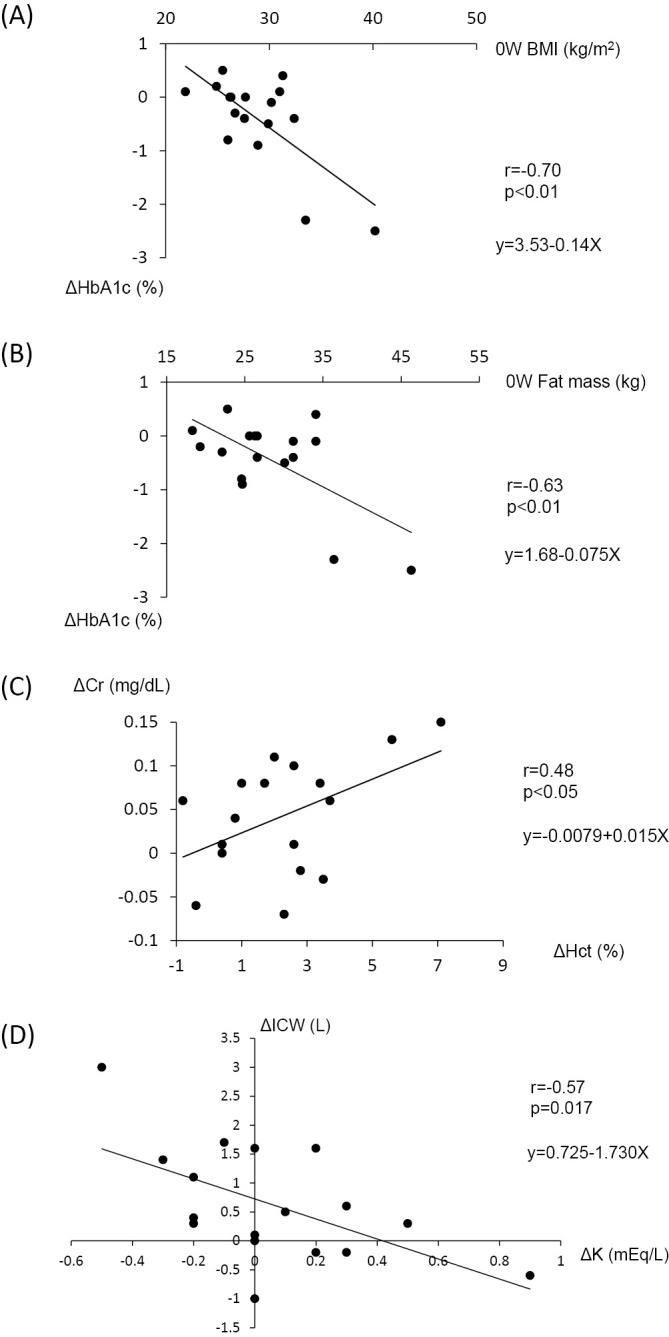
Scatter plots of the correlation analysis. Correlation between ΔHbA1c and 0W BMI (r=-0.70, p=0.002) (A), ΔHbA1c and 0W fat mass (r=-0.63, p=0.006) (B), ΔCr and ΔHct (r=0.48, p=0.049) (C), and ΔK and ΔICW (r=-0.57, p=0.017) (D). ΔHbA1c, ΔCr, ΔHct, ΔK, and ΔICW refer to the differences in HbA1c, Cr, Hct, K, and ICW, respectively, obtained by subtracting the values at week 8 from those at baseline.
