Fig. 4.

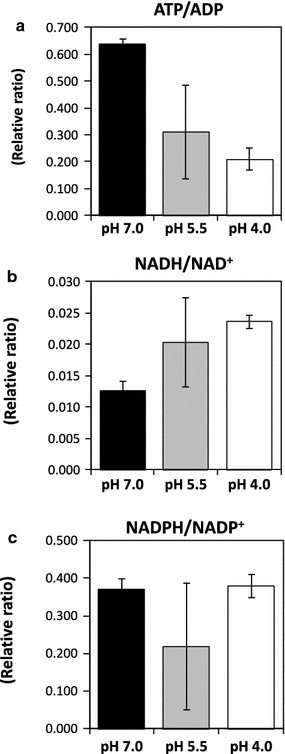
The relative ratios of a ATP/ADP, b NADH/NAD+, and c NADPH/NADP+ in the microbial fuel cells (pH 7.0: black bars, pH 5.5: gray bars, and pH 4.0: white bars) were calculated based on the amounts of these metabolites

The relative ratios of a ATP/ADP, b NADH/NAD+, and c NADPH/NADP+ in the microbial fuel cells (pH 7.0: black bars, pH 5.5: gray bars, and pH 4.0: white bars) were calculated based on the amounts of these metabolites