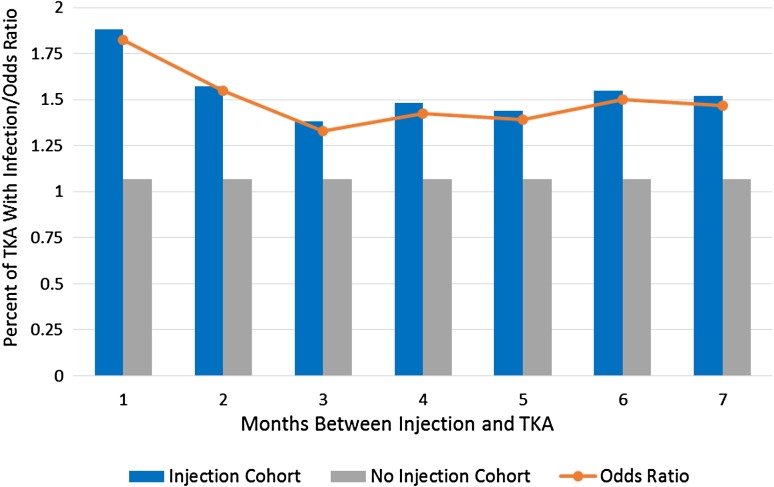
Fig. 2.
Graphic representation of the percent of TKA requiring operative intervention for TKA infection as well as ORs for this endpoint comparing both the injection and no injection cohorts with results delineated by time between injection and TKA. Results included are only those that were different (p < 0.05).

