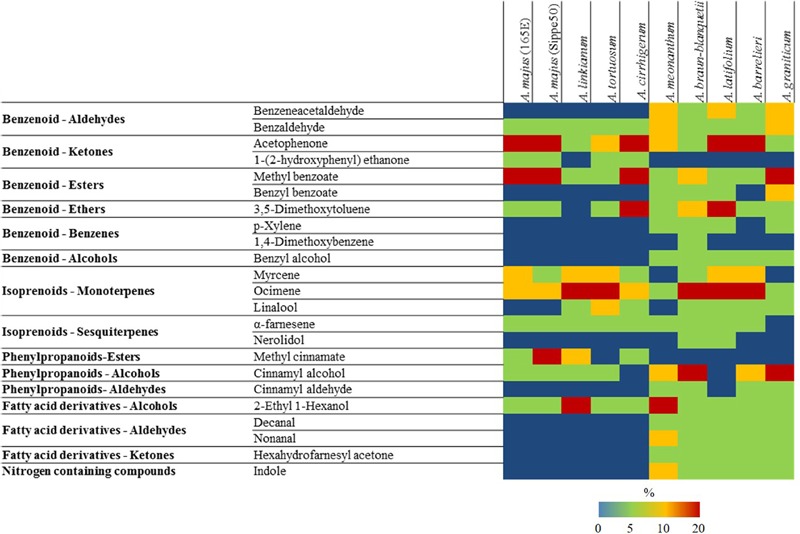
FIGURE 2.

Heat map with major VOCs (above 2% of total volatiles present in chromatograms) emitted by different species of Antirrhinum. Colors reflect the maximum level of emission (%) in stages I–III for each species. Key color emission: blue (0%), green (<5%), yellow (<20%), and red (>20%).
