FIGURE 3.

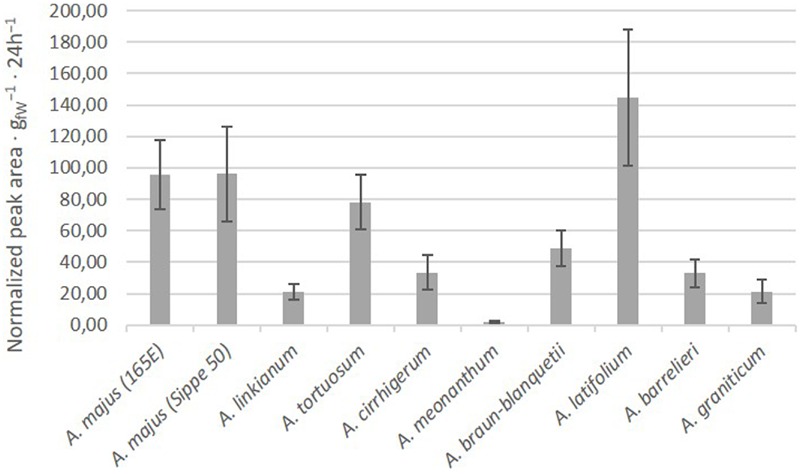
Average emission of VOCs in the different accessions. Quantities are total integrated area normalized to naphthalene/g 24 h-1. Error bars correspond to standard error.

Average emission of VOCs in the different accessions. Quantities are total integrated area normalized to naphthalene/g 24 h-1. Error bars correspond to standard error.