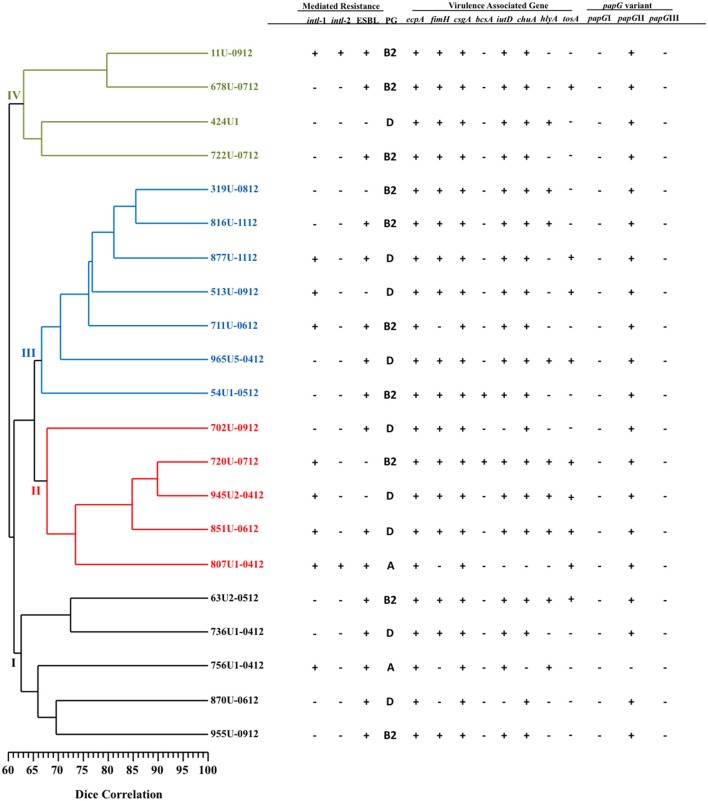
Figure 2.
PFGE analysis of 21 XDR-UPEC strains associated with virulence genes and their mechanisms of resistance. The diversity analysis was performed using the Sørensen-Dice similarity coefficient in association with the UPGMA algorithm. Additionally, the dendrogram was evaluated using the cophenetic correlation coefficient obtained by the Mantel test, which indicated the dispersion of the data and showed a value of r = 0.8037. The four clusters identified by PFGE are shown in different colors.

