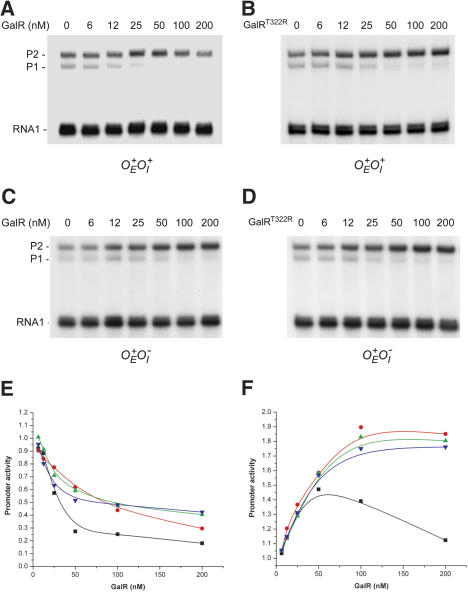
Figure 2.
Effect of GalR on gal promoters in vitro. Results of in vitro transcription at varying concentrations of GalR (A–D). Plasmid DNA template  (pSA850) with GalR+ (A), and GalRT322R (B). Plasmid DNA template
  (pSA886) with GalR+ (C) and GalRT322R (D). Quantification of activity of P1 (E) and P2 (F) at varying concentrations of GalR. RNA1 transcript, which does not vary with GalR concentration, was used as an internal control between lanes. Promoter activities in the absence of GalR were used as a reference (1.00) in each experiment. Plasmid DNA template
  (pSA850) with wild-type GalR (black squares), and GalRT322R (red dots). Plasmid DNA template
  (pSA886) with wild-type GalR (green triangles) and GalRT322R (blue triangles).

