FIGURE 4.

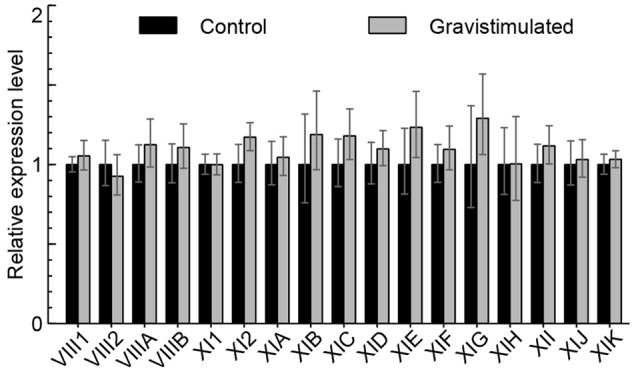
Myosin mRNA levels after 4 h of gravistimulation. RT-qPCR analysis of myosin mRNA levels in gravistimulated wild type plants relative to unstimulated control (set to 1). Error bars represent 95% CI, n = 12.

Myosin mRNA levels after 4 h of gravistimulation. RT-qPCR analysis of myosin mRNA levels in gravistimulated wild type plants relative to unstimulated control (set to 1). Error bars represent 95% CI, n = 12.