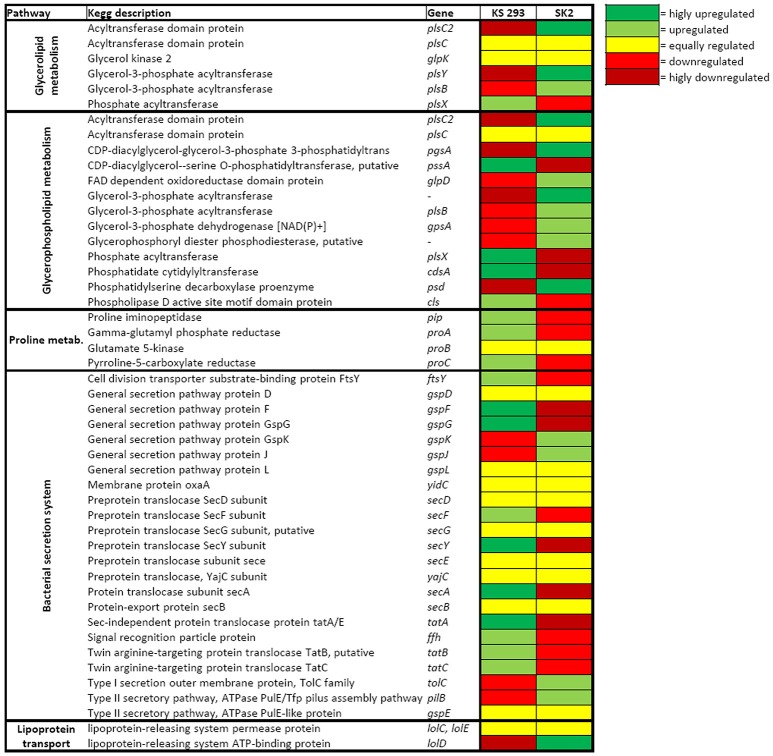
Figure 5.
Heat map of the transcription level of genes involved in biosurfactant production and secretion. Yellow indicates the same level of transcription, light green indicates upregulation, dark green indicates strong upregulation, red indicates downregulation and dark red indicates strong downregulation.

