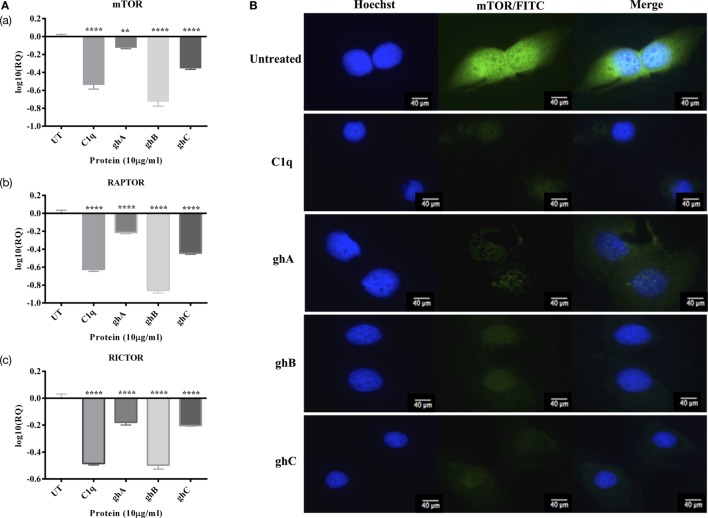
Figure 8.
(A) Relative quantification comparisons of mammalian target of rapamycin (mTOR) (a), RAPTOR (b), and RICTOR (c) mRNA expression in SKOV3 cells treated with C1q, ghA, ghB, and ghC (10 µg/ml) at 6 h. Significance was obtained using the unpaired one-way ANOVA test (*p < 0.05, *p < 0.01, and ***p < 0.001) (n = 3). (B) Immunofluorescence microscopy to show the presence of mTOR detected abundantly in the cytoplasm (green) of the untreated cells, compared to SKOV3 cells treated with C1q and globular heads at 15 h time point.

