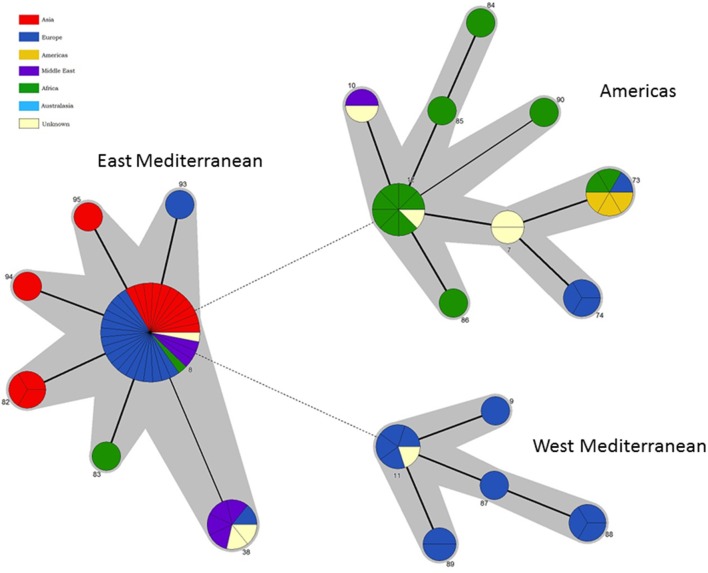
Figure 6.
Intraspecific relationships within B. melitensis. Minimum spanning tree showing the relationships between STs with the geographical origin (continent) of isolates highlighted. Each ST is represented by a circle the size of which reflects the number of isolates of that ST in the population analyzed here. Thick solid lines joining two types denote types differing at a single locus, thinner solid lines types differing at two loci, and dashed lines types differing at three or more loci. The gray halos surrounding groupings represent clusters defined in Bionumerics created if neighbors differed in no more than 2 of 21 loci.

