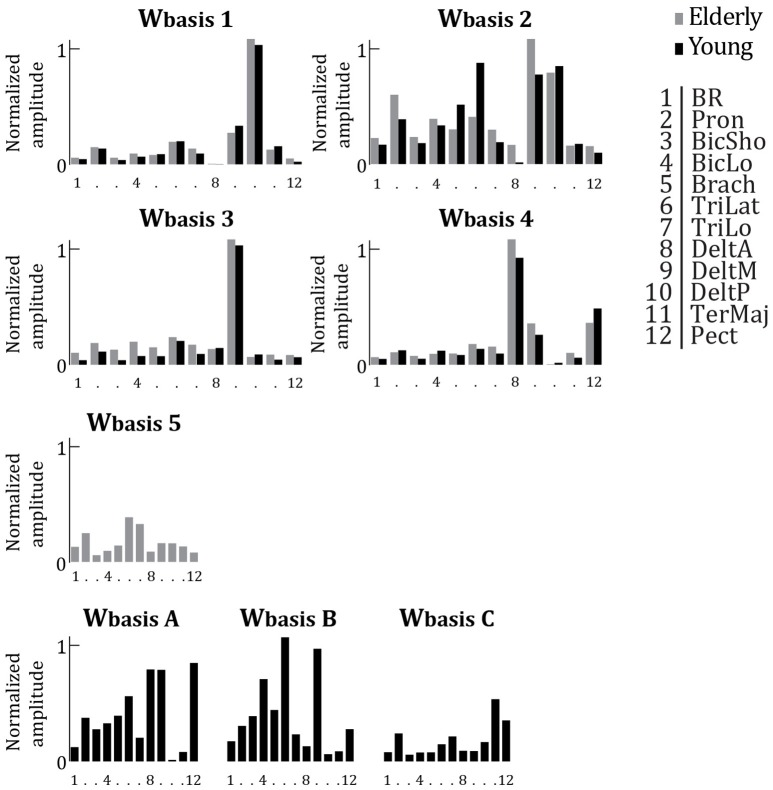
Figure 5.
Averaged synergy activation coefficients (Wbasis), replotted from Figure 4 (older adults, gray bars) and replotted from Vernooij et al. (2016) (young adults, black bars). Per basis synergy, the normalized activity of each of the 12 muscles is represented. Higher bars indicate increased strength of activity. Synergies are grouped based on correlation. Those synergies which were not significantly correlated to a synergy from the other age group are plotted separately (Wbasis 5 and Wbasis A, B, & C).

