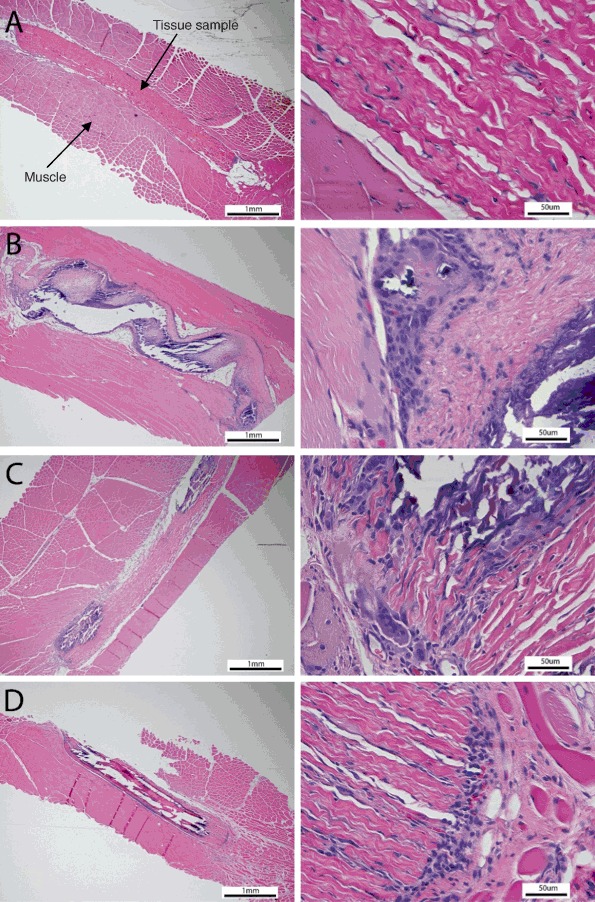
Fig. 4.

Representative H&E images of test (a), porcine tissue with AOA (b), bovine pericardium with Linx (c) and glutaraldehyde only tissue (d) tissue after 60 day implant. The left images are 25× and the right images are 400×. The blue dots are the giant cells and macrophages
