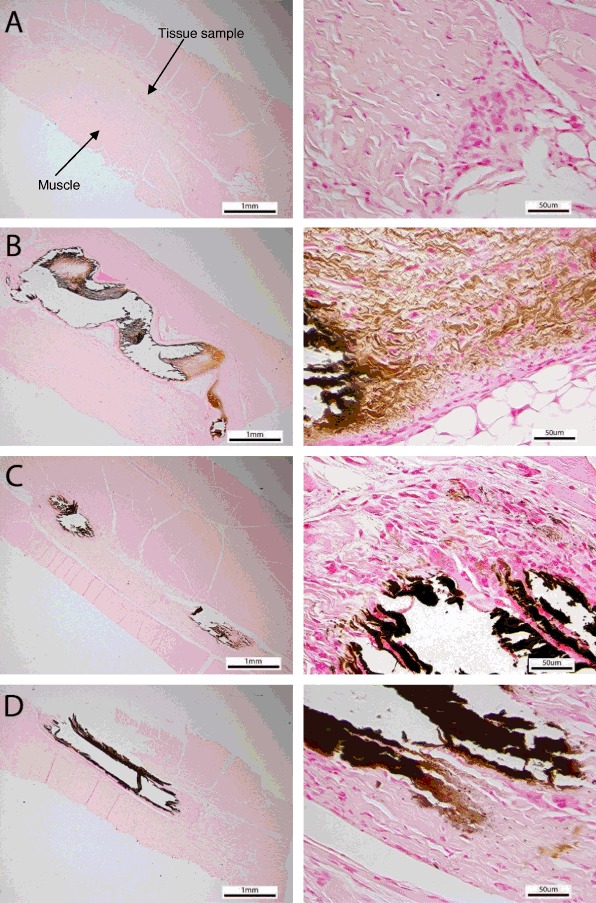
Fig. 5.

Representative von Kossa images of test (a), porcine tissue with AOA (b), bovine pericardium with Linx (c) and glutaraldehyde only tissue (d) tissue after 60 day implant. The left images are 25× and the right images are 400×. The brown color is the calcified sites
