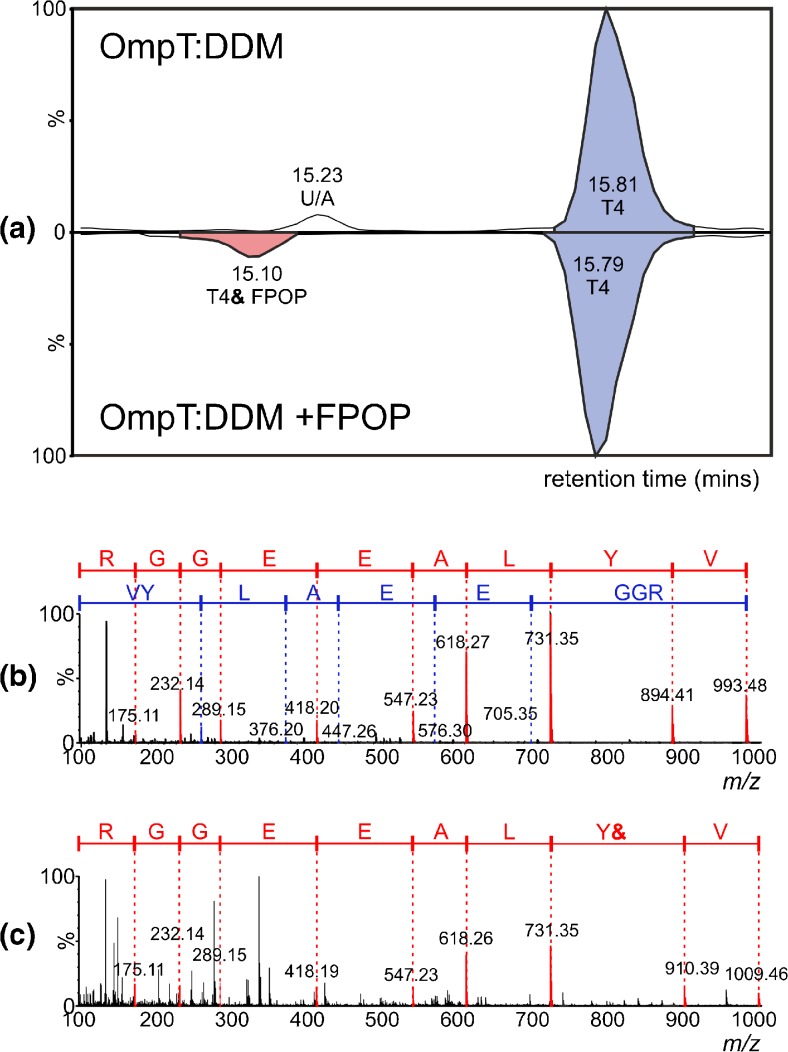
Figure 2.
LC-MS/MS analysis of the OmpT tryptic peptide T4 (residues 43-51) following FPOP. (a) Butterfly plot of LC-MS chromatograms showing unmodified T4 (blue peaks) in the absence of (upper trace) and following (lower trace) FPOP, and oxidized T4 (pink peak, lower trace, labelled “T4& FPOP”) following FPOP. U/A indicates an unassigned peak that was not identified as a modified or unmodified OmpT tryptic peptide; (b) and (c) show MS/MS spectra of unmodified and oxidized T4, respectively. The y” ions are labeled in red and the b ions in blue; the location of the modification site (Y44) is shown by the “Y&” symbol

