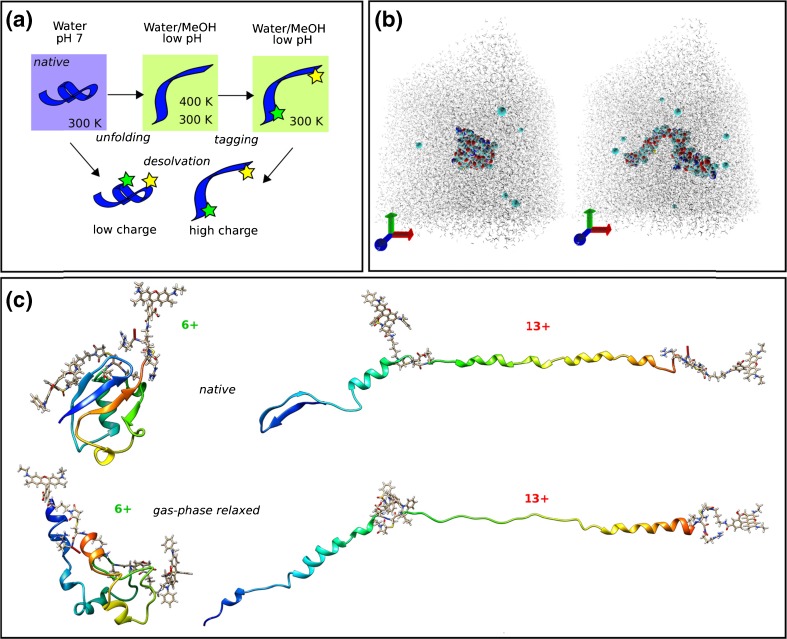
Figure 3.
Computational strategy for modeling of chromophore-tagged ubiquitin structures in the gas phase. (a) Schematic overview of simulation conditions chosen for different stages (stars denote chromophores), see main text; (b) color-inverted graphical representation of the H2O/CH3OH simulation box (including ions) featuring a natively folded ubiquitin (compact, left) and a partially unfolded structure (elongated, right); (c) structural properties of chromophore-tagged ubiquitin in the gas phase in a low (6+) and a high (13+) charge state after equilibration in the gas phase and replica-exchange MD. Peptide backbone in ribbon representation color coded by residue index (blue N-terminus, red C-terminus)

