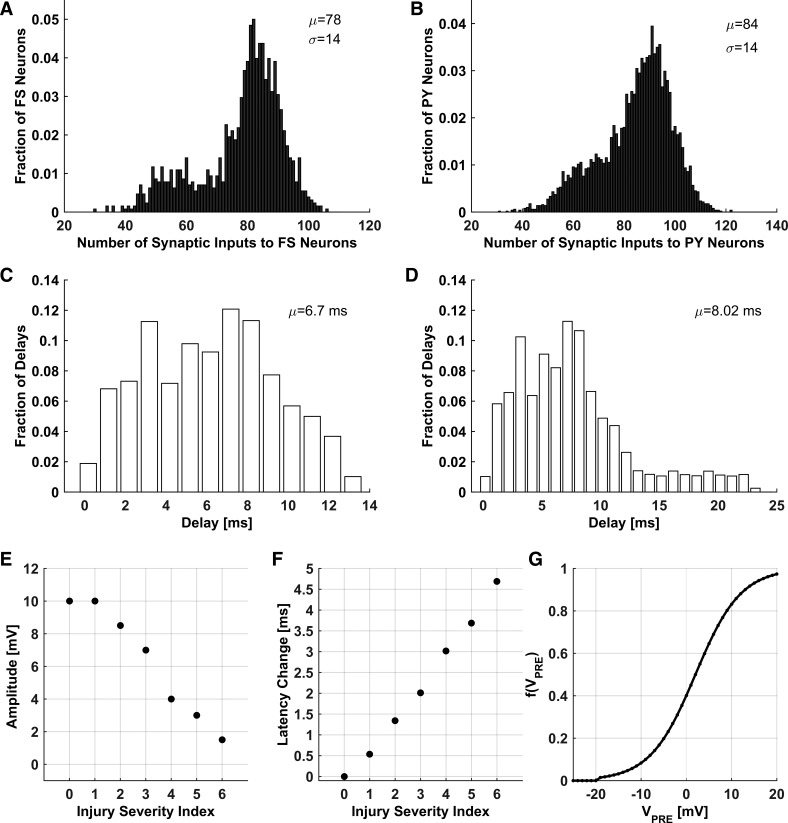
Fig. 1.
Characteristics of network structure. A and B: synaptic input distributions to FS (A) and PY (B) neurons. C: initial distribution of axonal conduction delays. D: distribution of axonal conduction delays after callosal injury (injury severity index = 6). E and F: axonal spike amplitude (E) and change in the average axonal spike latency (F) vs. injury severity index. G: synaptic event amplitude [f(VPre)] vs. presynaptic voltage (VPre).

